MEASURING HOUSING PRODUCTION IN LOS ANGELES
Triangulating Certificate of Occupancy, Assessor, and Census Data
Suggested Citation
Alvarez, Dario, Luis de la Rosa. Measuring Housing Production in Los Angeles. Los Angeles: Center for Pacific Urbanism, 2026.
ABSTRACT
This study examines how much housing has been produced in the City of Los Angeles, how the share of that production varies by building typology, and what the empirical record can contribute to current and future housing policy. Multiple data sources[1] are analyzed as independent measures of housing stock and production. The datasets show substantially greater historical rates of housing growth and a broader distribution of surviving housing among small and midsize building types than is represented in recent production. The convergence of independent measures during the 2010s supports the use of triangulation to evaluate housing production, while a substantial divergence between surviving 1960s construction and Census net housing-stock growth identifies an important area for further research into demolition, replacement, and urban renewal. The findings support decentralized, incremental housing production as a means of increasing supply while making productive use of the existing city: more housing, in more building types, on more parcels, produced by more people.
INTRODUCTION
The Center for Pacific Urbanism gathers and interprets public data to inform housing and land use policy, strengthen community self-determination, and advance shared responsibility in shaping the built environment. The Center's work grows from independent, empirical urban studies and spatial analysis starting in 2014 and expanded over the following decade. Since the establishment of the Journal of the Center for Pacific Urbanism in 2020, this research has been published and disseminated to advance more robust and informed public policy discourse and engagement.
Measuring Housing Production in Los Angeles is one in an ongoing series of longitudinal studies spanning over a decade of data gathering, analysis, and interpretation. These studies are performed within a framework of comprehensive rational planning for housing and land use policy in the broader Los Angeles region, with a particular emphasis on the City of Los Angeles. At the time of writing this article, housing remains a matter of central social, environmental, and economic consequence for communities in and around Los Angeles.
At several points in the history of Los Angeles, housing supply rates have been greater than today; this study explores multiple datasets to better understand how Los Angeles has produced housing over time and to help decisionmakers identify opportunities for complementary, different, and perhaps even better land use and housing policies.
Research Question
This study examines housing production in the City of Los Angeles by year and building typology.
How much housing has been produced in the City of Los Angeles over time, and how does recent production compare with the City's historical record?
The analysis then examines which building types have contributed most substantially to housing supply and how their share of housing production has changed over time.
Literature Review
A review of pertinent academic and policy literature regarding factors that contribute to housing supply rates situates this study in a broader context and offers several important observations, which are described in greater detail below. First, allowable density establishes productive capacity.[2] Los Angeles reduced its zoned capacity to less than half of its previous allowable capacity.[3] The existing housing stock provides evidence of housing production in relation to changing zoning regimes.[4] Building scale and type change the economics of housing production and the number of sites capable of producing housing.[5] Changes in the share of housing produced by building type therefore provide a measure of changes in the city's housing production system.[6]
First, allowable density is productive capacity. In high-demand cities, greater unbuilt zoned capacity is associated with greater housing production (Monkkonen, Manville, and Lens 2024). Allowable density establishes the number of dwelling units that can be produced from a given supply of land and the potential revenue available to support their production. Greater density distributes land, construction, financing, and other development costs among more dwelling units, while development standards affect how much of that capacity can actually be realized (Garcia et al. 2023; Garcia et al. 2024). In Los Angeles, where housing demand is high, increasing allowable density increases both the legal capacity and the economic opportunity to produce housing.
Second, Los Angeles reduced its zoned capacity to less than half of its previous allowable capacity. In 1960, the zoning of Los Angeles provided capacity for approximately 10 million people. By 1990, that capacity had fallen to approximately 4.5 million, a reduction of approximately 55 percent, even as demand for housing continued to grow (Morrow 2013; Monkkonen, Manville, and Lens 2024). While the physical capacity, and ostensibly the demand for housing, was not reduced, its legally allowed capacity was reduced through changes in land use policy and procedures. Los Angeles therefore contributed to its current housing shortage with substantially less legally available capacity to accommodate housing than it had provided historically.
Third, the existing housing stock provides evidence of housing production in relation to changing zoning regimes. The inventory of Los Angeles’ housing stock illustrates the amount and type of housing produced over time: small and midsize multifamily buildings characterize housing supply until the reductions in allowable density of the 1970s and ‘80s, after which housing production declines. Concurrent with the decline in housing supply is an increase in the share of dwelling units that is supplied by increasingly larger building types. In other words, a greater number of larger and larger buildings are dominating the supply of housing but housing supply rates overall have decreased. (Center for Pacific Urbanism 2020; Center for Pacific Urbanism 2022; Alvarez 2026). Examining building age and type alongside changes in allowable density provides a means of observing how the city's housing production system changed in relation to policies that regulate allowable density.
Fourth, changes in the share of housing produced by building type are analytically meaningful to the evaluation of housing policy. Los Angeles has produced housing through substantially different distributions of building types over time. Previous Center research found that nearly 59 percent of surviving housing produced during the 1960s is contained in buildings of 2–49 units, while subsequent periods show declining production in these types and increasing concentration in larger buildings (Center for Pacific Urbanism 2020, 2022; Alvarez 2026). These changes occurred alongside substantial changes in the city's allowable residential capacity. Measuring production by building type therefore provides a means of identifying changes in the structure of Los Angeles housing production that aggregate unit totals alone do not reveal.
Previous research by the Center for Pacific Urbanism examined Los Angeles housing production through the relationship between building type, building age, and the rate of dwelling-unit production. The Center's 2020 study, An Inventory of Housing Stock and Areas of Net Loss in Dwelling Units in Los Angeles, compared the surviving housing stock by building type and age with recent Certificate of Occupancy and demolition records. It is important to note that dwelling unit supply can be geographically disparate; when accounting for dwelling unit loss due to demolition or change of use to something other than residential use, there are areas of net loss of housing in the City of Los Angeles, even in years that experience a net increase in dwelling units at the City level (Center for Pacific Urbanism 2020; Center for Pacific Urbanism 2022). The present study retests the rate of dwelling-unit supply using updated data and multiple measures of housing stock and production.
Methods
This study examines housing production in the City of Los Angeles using U.S. Census Bureau decennial housing-unit counts, Los Angeles County Office of the Assessor parcel records, and Los Angeles Department of Building and Safety Certificate of Occupancy and building-permit records.
Historical Housing Stock
Decennial Census housing-unit counts are used to measure changes in the total housing stock. Assessor parcel records are used to examine the surviving housing stock by year built and number of dwelling units. Buildings subsequently demolished or substantially reconfigured are not represented in their original form; the Assessor data therefore represent surviving housing rather than complete historical production.
Building types are classified by number of dwelling units: 1 unit, 2–4 units, 5–9 units, 10–15 units, 16–24 units, 25–49 units, 50–99 units, and 100 or more units. Records that cannot be classified from the available information are retained as unknown.
Previous Center studies examined housing stock within residential land use designations. The present study expands the geographic scope of the Assessor analysis to include housing on commercially designated land. This change substantially increases the housing captured in recent periods; for the 2010s, the earlier analysis identified approximately 42,000 surviving dwelling units, while the expanded analysis identifies approximately 82,000. The difference reflects the expanded land use scope of the present analysis and should not be interpreted as a revision to the historical year-built records.
Recent Housing Production
Recent housing production is examined in two stages. A preliminary analysis uses the Los Angeles Department of Building and Safety's publicly available Building and Safety - Certificate of Occupancy dataset to measure completed housing production by year and building type. A subsequent analysis uses three chronological segments of the LADBS Building Permits data series: Building and Safety - Building Permits Issued Before 2010 (N); Building and Safety - Building Permits Issued Between 2010 and 2019 (N); and Building and Safety - Building Permits Issued from 2020 to Present (N). Together, these records are used to evaluate recent completed housing production, dwelling-unit additions and losses, project completion, and building type.
The analysis measures completed dwelling-unit production rather than permits issued. Production year is assigned from Certificate of Occupancy or completion information rather than permit issuance date. Base permits, supplemental permits, and corrections associated with the same project are evaluated together to avoid duplicate additions or losses. Reported dwelling-unit changes are reconciled and validated against the underlying permit records where necessary. Work descriptions are used to identify dwelling-unit creation or removal only where the description provides sufficient evidence to establish the change; ambiguous records are not assigned a dwelling-unit change by inference.
Validated positive dwelling-unit changes are classified as gross dwelling units added and validated negative changes as dwelling units lost. Net production is calculated where both additions and losses are sufficiently represented in the underlying records. Because dwelling-unit losses have not been completely incorporated into the production analysis, results for which losses are incomplete are reported as completed dwelling-unit production rather than citywide net housing-stock change.
For recent-production analysis, permits are assigned to dwelling-unit categories using the permit-level Sum_Units value, with categories of 1, 2–4, 5–9, 10–15, 16–24, 25–49, 50–99, and 100 or more units. Permit type and work-description text are screened for explicit building-wide unit totals and clear statements of conversion to a specified unit count. When such a total is identified, it is used to classify the record; counts described only as units added are not assumed to represent the building's post-work total. Records are flagged for review when permit-level counts may not represent the whole building, when relevant counts are missing or inconsistent, or when ADU or junior ADU work is indicated. Records for which a dwelling-unit category does not apply are coded as not applicable. These classifications are automated screening results and have not been independently verified against property histories or building-level records.
The screening process flagged 42,867 records for review. Among records with a positive Sum_Units, 288 were assigned to a different dwelling-unit category than would result from direct classification of Sum_Units alone. Records not flagged did not trigger the review rules and were not independently verified as accurate.
Comparison of Multiple Measures
Census, Assessor, and LADBS data are compared according to what each dataset measures. Census data measure change in the total housing stock; Assessor data identify surviving housing by year built; and LADBS records identify completed permitted housing production. Differences among these measures are examined in relation to their units of observation, dates, definitions, administrative purposes, and coverage. Comparing multiple measures allows periods of close correspondence and substantial divergence to be identified and investigated.
Results
1. Los Angeles has produced housing at substantially different rates over time. Census data show net increases in the city's housing stock of 166,457 units during the 1940s and 298,186 during the 1950s, followed by 82,541 during the 1960s, 112,964 during the 1970s, 111,416 during the 1980s, 37,485 during the 1990s, 73,036 during the 2000s, and 82,492 during the 2010s. The 1950s represent the greatest decennial increase measured by the Census data, more than three times the net increase recorded during the 2010s.

Figure 1. Net increase in dwelling units in the City of Los Angeles by decade, 1940s–2010s.
Source: IPUMS National Historical Geographic Information System, Version 16.0 (Manson et al. 2021), using U.S. Census Bureau decennial housing-unit counts.
2. Small and midsize buildings constitute a substantial share of the existing housing stock. Of approximately 1.47 million dwelling units represented in the Assessor analysis, 460,094, or 31.2 percent, are in one-unit buildings. Buildings containing 2–49 dwelling units account for 706,487 units, or approximately 48 percent of the existing stock. Buildings containing 50–99 units account for 122,055 units, and buildings containing 100 or more units account for 183,740. The surviving stock from the 1920s provides an early example of substantial production across building types: 204,211 surviving dwelling units have years built from 1920 through 1929, including 67,277 in one-unit buildings and 63,015 in 2–4-unit buildings.
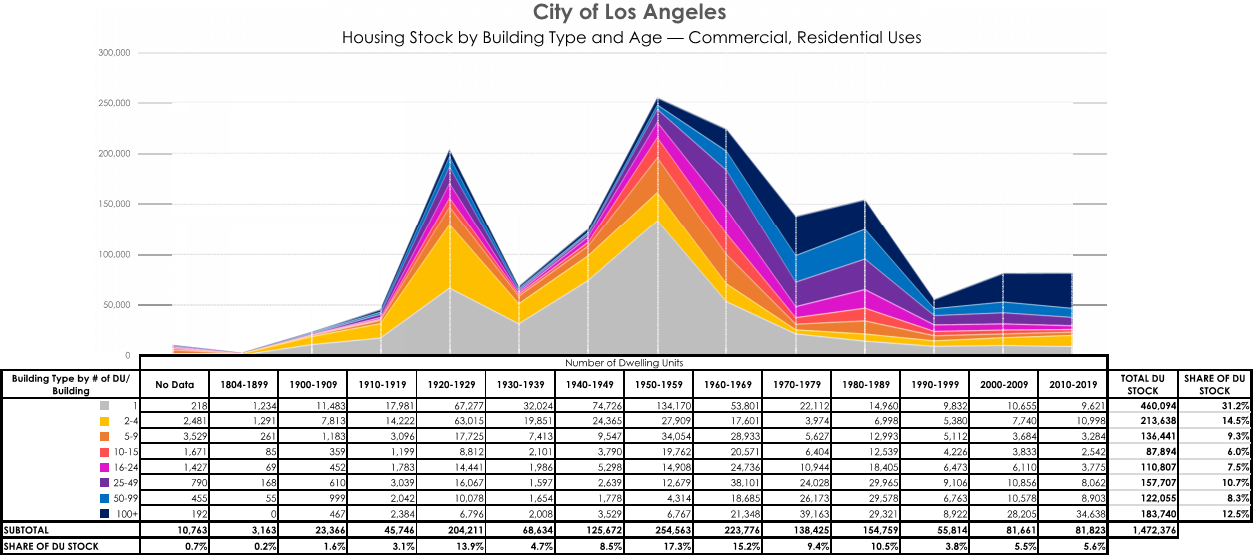
Figure 2. Surviving City of Los Angeles housing stock by building type and year built.
Source: Los Angeles County Office of the Assessor, Secured Local Roll; Center for Pacific Urbanism analysis.
3. The 1960s surviving housing stock is predominantly represented by small and midsize multifamily buildings. The Assessor inventory contains 223,776 surviving dwelling units built during the 1960s. Of these, 129,942, or 58.1 percent, are in buildings containing 2–49 dwelling units, compared with 53,801 in one-unit buildings, 18,685 in buildings containing 50–99 units, and 21,348 in buildings containing 100 or more units. The 25–49-unit category alone accounts for 38,101 units. By comparison, the surviving 1950s stock contains 254,563 dwelling units, including 134,170 in one-unit buildings.

Figure 3. Completed dwelling-unit production in the City of Los Angeles by year and project dwelling-unit category, 2003–2026.
Source: Los Angeles Department of Building and Safety, Certificate of Occupancy records; Center for Pacific Urbanism analysis.
4. The share of surviving housing represented by small and midsize buildings declines substantially in more recent periods. The Assessor inventory identifies 138,425 surviving units built during the 1970s, 154,759 during the 1980s, 55,814 during the 1990s, 81,661 during the 2000s, and 81,823 during the 2010s. Buildings containing 100 or more dwelling units account for 28,205 of the surviving units built during the 2000s and 34,638 during the 2010s. The 5–49-unit categories collectively account for 24,483 units during the 2000s and 17,663 during the 2010s.
5. Recent completed housing production has increased, with production concentrated in the largest and smallest building categories. Certificate of Occupancy records identify 246,689 dwelling units associated with completed records from 2003 through 2026. Production totaled 10,629 units in 2010 and 4,394 in 2011, increasing unevenly to 14,343 in 2019. The 2010–2019 period produced 88,947 dwelling units. Annual production subsequently reached 17,407 units in 2020, 18,241 in 2021, 16,919 in 2022, 16,257 in 2023, 20,225 in 2024, and 19,505 in 2025. The 2026 total of 15,648 represents a partial year through October 8, 2026.
Across the analyzed Certificate of Occupancy records, buildings containing 100 or more dwelling units account for 90,487 units, followed by one-unit buildings with 60,942 units and buildings containing 50–99 units with 31,194. Buildings containing 2–49 units collectively account for 65,556 units: 20,444 in 2–4-unit buildings, 7,069 in 5–9-unit buildings, 5,712 in 10–15-unit buildings, 9,214 in 16–24-unit buildings, and 23,117 in 25–49-unit buildings. Because dwelling-unit losses have not been completely incorporated into the production analysis, results for which losses are incomplete represent completed dwelling-unit production rather than citywide net housing-stock change.
6. The three independent measures converge closely for the 2010s. Certificate of Occupancy records identify 88,947 dwelling units produced from 2010 through 2019. The Census records a net increase of 82,492 dwelling units during the decade, while the Assessor inventory contains 81,823 surviving dwelling units with years built from 2010 through 2019. The three independently derived measures converge within 7,124 units, or approximately 8.7 percent of the Assessor total.
7. The Census and Assessor measures diverge substantially for the 1960s. The Assessor inventory identifies 223,776 surviving dwelling units constructed from 1960 through 1969, while the Census records a net increase of 82,541 dwelling units during the decade, a difference of 141,235 units. The Assessor measure represents surviving units by year built and the Census measure represents change in the total housing stock; the difference therefore does not establish the number or type of units removed during the decade. The 141,235-unit divergence identifies a substantial difference between surviving construction attributed to the 1960s and net growth in the city's housing stock during the same period.
Discussion
The historical record indicates that Los Angeles has produced housing at substantially greater rates than it does today and that periods of greater production included a broader range of building types. The surviving housing stock of the 1960s is particularly instructive. Of 223,776 surviving dwelling units constructed during the decade, 129,942 are in buildings containing 2-49 units. The historical record therefore expands the range of building types relevant to contemporary housing policy beyond the prevailing alternatives of large multifamily development and accessory dwelling units, duplexes, and fourplexes. Buildings containing 5, 10, 20, or 40 dwelling units have also produced housing in Los Angeles at meaningful scale.
The comparison between the Assessor and Census data raises a second and potentially more consequential question. The Assessor inventory contains 223,776 surviving units constructed during the 1960s, while the Census records a net increase of only 82,541 units during the decade. The difference of 141,235 units requires further investigation. If the difference substantially represents concurrent housing loss, then the 1960s would demonstrate that a city can produce housing at a very high rate while realizing a much smaller increase in its housing stock.
The amount of existing housing removed to accommodate that production determines how much housing is actually added. A useful measure is therefore how many additional units a development produces relative to the housing it displaces.
Building type may be important to this relationship. The present analysis establishes substantial historical production across building types but does not yet establish which building types were associated with demolition or the number of existing units removed for their construction. That question should be tested directly. A large development replacing existing housing produces a different net contribution to supply than the same number of gross units distributed among additions, conversions, additional stories, underutilized portions of developed parcels, and new construction requiring little or no residential demolition.
This provides a more precise meaning for decentralized density. Density can be distributed across the existing city through many parcels, building types, project sizes, and producers. Existing floor area can be converted to housing; existing buildings can accommodate additional units and stories; underutilized portions of parcels can accommodate new buildings; and ground-up construction can occur where substantial additional capacity exists. The objective is to increase the housing stock while preserving the productive value of housing that already exists.
The historical record also suggests different modes of housing production across periods. The surviving 1920s stock is distributed broadly among small and multifamily building types. More than half of the surviving Assessor stock constructed during the 1950s is contained in one-unit buildings, while the 1960s show substantially greater production across multifamily building types. The relationship between these transitions, outward expansion, redevelopment, urban renewal, freeway construction, demolition, and changes in land use policy warrants further study. The 141,235-unit discrepancy provides a quantitative basis for investigating that history.
Contemporary production presents a different problem. The three independent measures for the 2010s are remarkably close: 88,947 units in the Certificate of Occupancy analysis, 82,492 additional units measured by the Census, and 81,823 surviving units in the Assessor inventory. Recent production has increased further, reaching approximately 20,000 completed units annually in 2024 and 2025 according to the Certificate of Occupancy analysis. While these increases are meaningful, the historical record establishes substantially greater benchmarks for housing-stock growth and a wider distribution of productive building types.
The historical record demonstrates greater productive capacity, a wider range of productive building types, and periods in which housing was produced across a broader development landscape. The opportunity is to recover that capacity while making productive use of the city that already exists. More housing, in more building types, on more parcels, produced by more participants, with less displacement of existing housing provides a more complete measure of the production system Los Angeles needs.
Areas for Further Research
The difference between the 223,776 surviving dwelling units constructed during the 1960s and the Census measure of 82,541 net additional units warrants direct investigation. Historical demolition records, urban renewal programs, redevelopment activity, freeway construction, institutional expansion, and other sources of housing loss should be examined to determine how much housing was removed during this period, where those losses occurred, and what types of housing were removed. The planning ideas that supported clearance and replacement, including contemporary concepts of congestion, urban renewal, and the existing urban fabric, also warrant study.
The relationship between demolition and building type presents a related opportunity. Future research should measure the number and type of existing dwelling units removed for new housing and compare those losses with the number and type of units subsequently produced. This would allow gross production, displacement, and net additional supply to be measured by project scale and building type and test whether larger developments have historically required greater removal of existing housing while smaller and midsize forms have been more readily accommodated through infill.
The historical role of midsize housing and land use designation should be examined together. The existing housing stock demonstrates substantial production in the 5-9, 10-15, 16-24, and 25-49-unit ranges, particularly during periods of greater overall production. Further research should examine the parcels, zoning, construction types, financing, ownership, and development standards that made these buildings possible; determine how much historical and contemporary housing has been produced on residentially and commercially designated land; and compare building type, parcel area, dwelling units per acre, and allowable density over time. The Housing Allocation Index[7] and related Community Plan research provide a basis for extending this work from historical observation to future housing targets.
Development cost, financing, and construction methods should be examined together. The cost of producing comparable 4-unit, 20-unit, and 200-unit buildings should be examined together with equity, loan-to-cost and loan-to-value requirements, guarantees, borrower experience, reserves, contingencies, and permanent financing. Prefabrication, modular construction, standardized components, local labor, new tradespeople, and conventional fabrication can be compared on delivered cost, time, financing, transportation, foundations, professional services, permitting, and overhead. The opportunity is to identify methods that reduce the cost of housing production while expanding productive capacity and the number of people capable of participating.
Recent policy approaches and methods for measuring housing production should continue to be evaluated empirically. Density bonuses, inclusionary requirements, development incentives, expedited approvals, fee reductions, and changes to base development capacity can be compared against completed housing production by amount, type, location, affordability, and net addition. The close correspondence among Certificate of Occupancy, Census, and Assessor measures during the 2010s provides an opportunity to develop a repeatable method for measuring housing production in Los Angeles, while differences among the datasets identify questions of demolition, replacement, timing, administrative classification, data coverage, and change in the physical housing stock.
Conclusion
Los Angeles has produced housing at substantially greater rates than it does today. The historical record provides several models for doing so. The surviving stock of the 1920s, the scale of housing-stock growth in the 1950s, and the broad multifamily distribution represented in the 1960s provide different precedents. The opportunity is to learn from what each period accomplished while improving upon its consequences.
The recent increase in housing production is meaningful. It is also a call to action. If the policies presently in place produce approximately 20,000 completed dwelling units per year, the relevant question is how those policies can produce 60,000 or more per year. Historical production demonstrates that substantially greater rates are possible. The task is to understand how they were achieved and develop a contemporary production system capable of doing better.
The historical record also provides important qualifications. The scale of the 1950s need not be reproduced through outward expansion or the loss of agricultural land. The 1960s produced at least 223,776 dwelling units that remain in the Assessor inventory today, yet the Census records net housing-stock growth of only 82,541 units during the decade. Further research is necessary to explain this difference. The difference raises an important question for contemporary policy: how can Los Angeles increase gross production while also protecting the housing already contributing to the city's supply?
The building types that accomplished this historically remain throughout Los Angeles. Nearly half of the existing housing stock represented in the Assessor analysis is in buildings containing 2-49 dwelling units. These buildings provide an existing vocabulary of small and midsize housing types. They can be complemented by incremental production through additional units on existing parcels, conversions of existing floor area, additions to existing buildings, additional stories, and infill. An additional dwelling unit or two on a parcel has already become commonplace. Allowing four, five, six, or seven units on substantially more parcels extends the same principle and provides a subject for direct testing against housing need, existing development, and displacement.
This is the opportunity of decentralized density. Housing production can occur across thousands of properties and through a broad range of building types and producers. A property owner can add several units. A small builder can produce a small apartment building. A local developer can produce twenty or forty units. Larger organizations can continue producing hundreds. These activities can occur simultaneously. Greater allowable density increases the number of units and sites with the potential to participate in housing production.
Housing production also presents an opportunity for economic participation. Producing housing requires tradespeople, contractors, architects, engineers, fabricators, suppliers, lenders, property owners, and entrepreneurs. Expanding housing production across more properties, building types, and project scales expands the opportunities for people to participate in producing it. Solving the housing shortage therefore presents an opportunity to build productive capacity within communities and put more people to work producing the city in which they live. Land use, construction, and finance can create the conditions for that production to occur locally and at many scales.
Greater housing supply matters because the quantity of housing available affects its price. Increasing the supply of housing relative to demand places downward pressure on housing prices and rents. Where demand is growing, additional production can moderate price increases; where housing production fails to keep pace with demand, scarcity places upward pressure on prices. A housing policy concerned with affordability should therefore be concerned with the capacity of the housing supply to grow in response to demand.
Build more housing, in more building types, on more parcels, through more producers, while preserving as much of the existing city as practicable. Increase capacity for local and incremental production. Allow neighborhoods to accommodate growth through additions, conversions, infill, and new buildings. Create opportunities for people to produce housing, participate economically in that production, and exercise greater agency over their properties and communities.
The recent increase in production is evidence that policy can change the trajectory. The historical record establishes a more ambitious benchmark and a broader set of building types through which to pursue it. The opportunity now is to learn from that record and build more.
Sí se puede.
About the Authors
Dario Alvarez, AIA, is an architect, planner, and founder of the Center for Pacific Urbanism.
Luis de la Rosa is a registered architect and researcher with the Center for Pacific Urbanism.
References
Alvarez, Dario. 2026. Los Angeles Housing Crisis: Source and Solution: Decentralized Density, Technology for Agency, and Governance through Self-Determination. Los Angeles: Center for Pacific Urbanism.
Bento, Antonio, Scott E. Lowe, Gerrit-Jan Knaap, and Arnab Chakraborty. 2009. “Housing Market Effects of Inclusionary Zoning.” Cityscape: A Journal of Policy Development and Research 11 (2): 7–26.
California Department of Housing and Community Development. 2017. California’s Housing Future: Challenges and Opportunities. Sacramento: California Department of Housing and Community Development.
California Government Code § 65913.1.
Center for Pacific Urbanism. 2020. An Inventory of Housing Stock and Areas of Net Loss in Dwelling Units in Los Angeles. Los Angeles: Center for Pacific Urbanism.
Center for Pacific Urbanism. 2022. Journal of the Center for Pacific Urbanism: City of Los Angeles Special Issue. Los Angeles: Center for Pacific Urbanism.
City of Los Angeles. Building and Safety - Building Permits Issued Before 2010 (N). Los Angeles Open Data Portal, Department of Building and Safety. Accessed October 2026.
Building Permits Issued Before 2010
City of Los Angeles. Building and Safety - Building Permits Issued Between 2010 and 2019 (N). Los Angeles Open Data Portal, Department of Building and Safety. Accessed October 2026.
Building Permits Issued Between 2010 and 2019
City of Los Angeles. Building and Safety - Building Permits Issued from 2020 to Present (N). Los Angeles Open Data Portal, Department of Building and Safety. Accessed October 2026.
Building Permits Issued from 2020 to Present
City of Los Angeles. Building and Safety - Certificate of Occupancy. Los Angeles Open Data Portal, Department of Building and Safety. Accessed October 2026.
Certificate of Occupancy dataset
Garcia, David, Ian Carlton, Lacy Patterson, and Jacob Strawn. 2023. Making It Pencil: The Math Behind Housing Development—2023 Update. Terner Center for Housing Innovation, University of California, Berkeley.
Garcia, David, Ian Carlton, Lacy Patterson, Jacob Strawn, and Ben Metcalf. 2024. Making Missing Middle Pencil: The Math Behind Small-Scale Housing Development. Terner Center for Housing Innovation, University of California, Berkeley.
Kahlenberg, Richard D. 2017. An Economic Fair Housing Act. The Century Foundation.
Knaap, Gerrit, Stuart Meck, Terry Moore, and Robert Parker. 2007. Zoning as a Barrier to Multifamily Housing Development. American Planning Association.
Los Angeles County Office of the Assessor. 2026. Secured Local Roll [dataset]. Los Angeles: Data Sales Unit, Information Technology Division, Los Angeles County Office of the Assessor.
Manson, Steven, Jonathan Schroeder, David Van Riper, Tracy Kugler, and Steven Ruggles. 2021. IPUMS National Historical Geographic Information System: Version 16.0 [dataset]. Minneapolis, MN: IPUMS. doi:10.18128/D050.V16.0
McKinsey Global Institute. 2016. A Tool Kit to Close California’s Housing Gap: 3.5 Million Homes by 2025. McKinsey & Company.
McKinsey Global Institute. 2019. Affordable Housing in Los Angeles: Delivering More—and Doing It Faster. McKinsey & Company.
Monkkonen, Paavo, Michael Manville, and Michael Lens. 2024. “Built Out Cities? A New Approach to Measuring Land Use Regulation.” Journal of Housing Economics 63: 101982. doi:10.1016/j.jhe.2024.101982
Morrow, Gregory D. 2013. The Homeowner Revolution: Democracy, Land Use and the Los Angeles Slow-Growth Movement, 1965–1992. PhD diss., University of California, Los Angeles.
O’Sullivan, Tony, and Kenneth Gibb, eds. 2002. Housing Economics and Public Policy. Blackwell Science.
Raetz, Hayley, Teddy Forscher, Elizabeth Kneebone, and Carolina Reid. 2020. The Hard Costs of Construction: Recent Trends in Labor and Materials Costs for Apartment Buildings in California. Terner Center for Housing Innovation, University of California, Berkeley.
Richman, S., D. Donoghue, L. Saunders, R. Ames, R. Anthony, S. Ash, P. Bernier, et al. 2000. In Short Supply: Recommendations of the Los Angeles Housing Crisis Task Force. Los Angeles City Council.
Rodman-Alvarez, Dario, Renae Zelmar, Rudi Mattheis-Brown, and Luis Ricardo de la Rosa. 2022. The Housing Allocation Index to Meet the 2029 RHNA Targets for the City of Los Angeles by Community Plan Area. Los Angeles: Center for Pacific Urbanism.
Schuetz, Jenny, Rachel Meltzer, and Vicki Been. 2009. “31 Flavors of Inclusionary Zoning: Comparing Policies from San Francisco, Washington, DC, and Suburban Boston.” Journal of the American Planning Association 75 (4): 441–456. doi:10.1080/01944360903146806
Taylor, Mac. 2015. California’s High Housing Costs: Causes and Consequences. Sacramento: Legislative Analyst’s Office.
Theologides, Stergios. 2026. The Evolution of Residential Transition Lending: From Hard Money to Housing Supply? Urban Institute.
Citations
[1] Data sources include U.S. Census Bureau decennial housing-unit counts, Los Angeles County Office of the Assessor parcel records, and Los Angeles Department of Building and Safety Certificate of Occupancy and permit records.
[2] See Monkkonen, Manville, and Lens (2024) for an empirical analysis of zoned capacity as a measure of land-use regulation and its relationship to housing production; see also Alvarez et al. (2026) for the application of allowable density as housing-production capacity in Los Angeles. Monkkonen, Manville, and Lens find that unbuilt zoned capacity predicts housing production particularly in high-demand cities.
[3] See Morrow (2013) for the historical reduction in Los Angeles's zoned capacity; see also Monkkonen, Manville, and Lens (2024) for its relationship to land use regulation and housing production.
[4] See Center for Pacific Urbanism (2020, 2022) and Alvarez et al. (2026) for analyses of the Los Angeles housing stock by building type and age and its relationship to changes in housing production and land-use policy. The Center's subsequent work identifies a substantial historical contribution from buildings containing 2–49 dwelling units and a later shift toward production concentrated in larger building types.
[5] See McKinsey Global Institute (2019) for analysis of development economics across housing types and the relationship between density, development cost, achievable rents, and financial feasibility. Its Los Angeles analysis also identifies substantial potential production distributed across tens of thousands of underutilized low- and mid-rise parcels.
[6] See Center for Pacific Urbanism (2020, 2022) and Alvarez et al. (2026) for longitudinal analyses of changes in Los Angeles housing production by building type. Alvarez et al. connect the distribution of allowable density among building types and properties with the amount of housing that can be produced and the range of participants capable of producing it.
[7] See Rodman-Alvarez et al. (2022). The Housing Allocation Index (HAI) is a method developed by the Center for Pacific Urbanism to distribute housing targets among Los Angeles Community Plan Areas using measures of affordability, environmental health, transit access, historical downzoning, and opportunity. The resulting allocation provides a geographically differentiated basis for translating citywide housing targets into Community Plan-level housing targets.