Incremental and Corridor Capacity in Los Angeles
A Test of Whether ADUs and Boulevards Can Meet Housing Need
Suggested Citation
Alvarez, D., Ricardo de la Rosa, L. (2026) Incremental and Corridor Capacity in Los Angeles: A Test of Whether ADUs and Boulevards Can Meet Housing Need. Los Angeles, CA. Center for Pacific Urbanism.
I. Introduction: The Production Problem
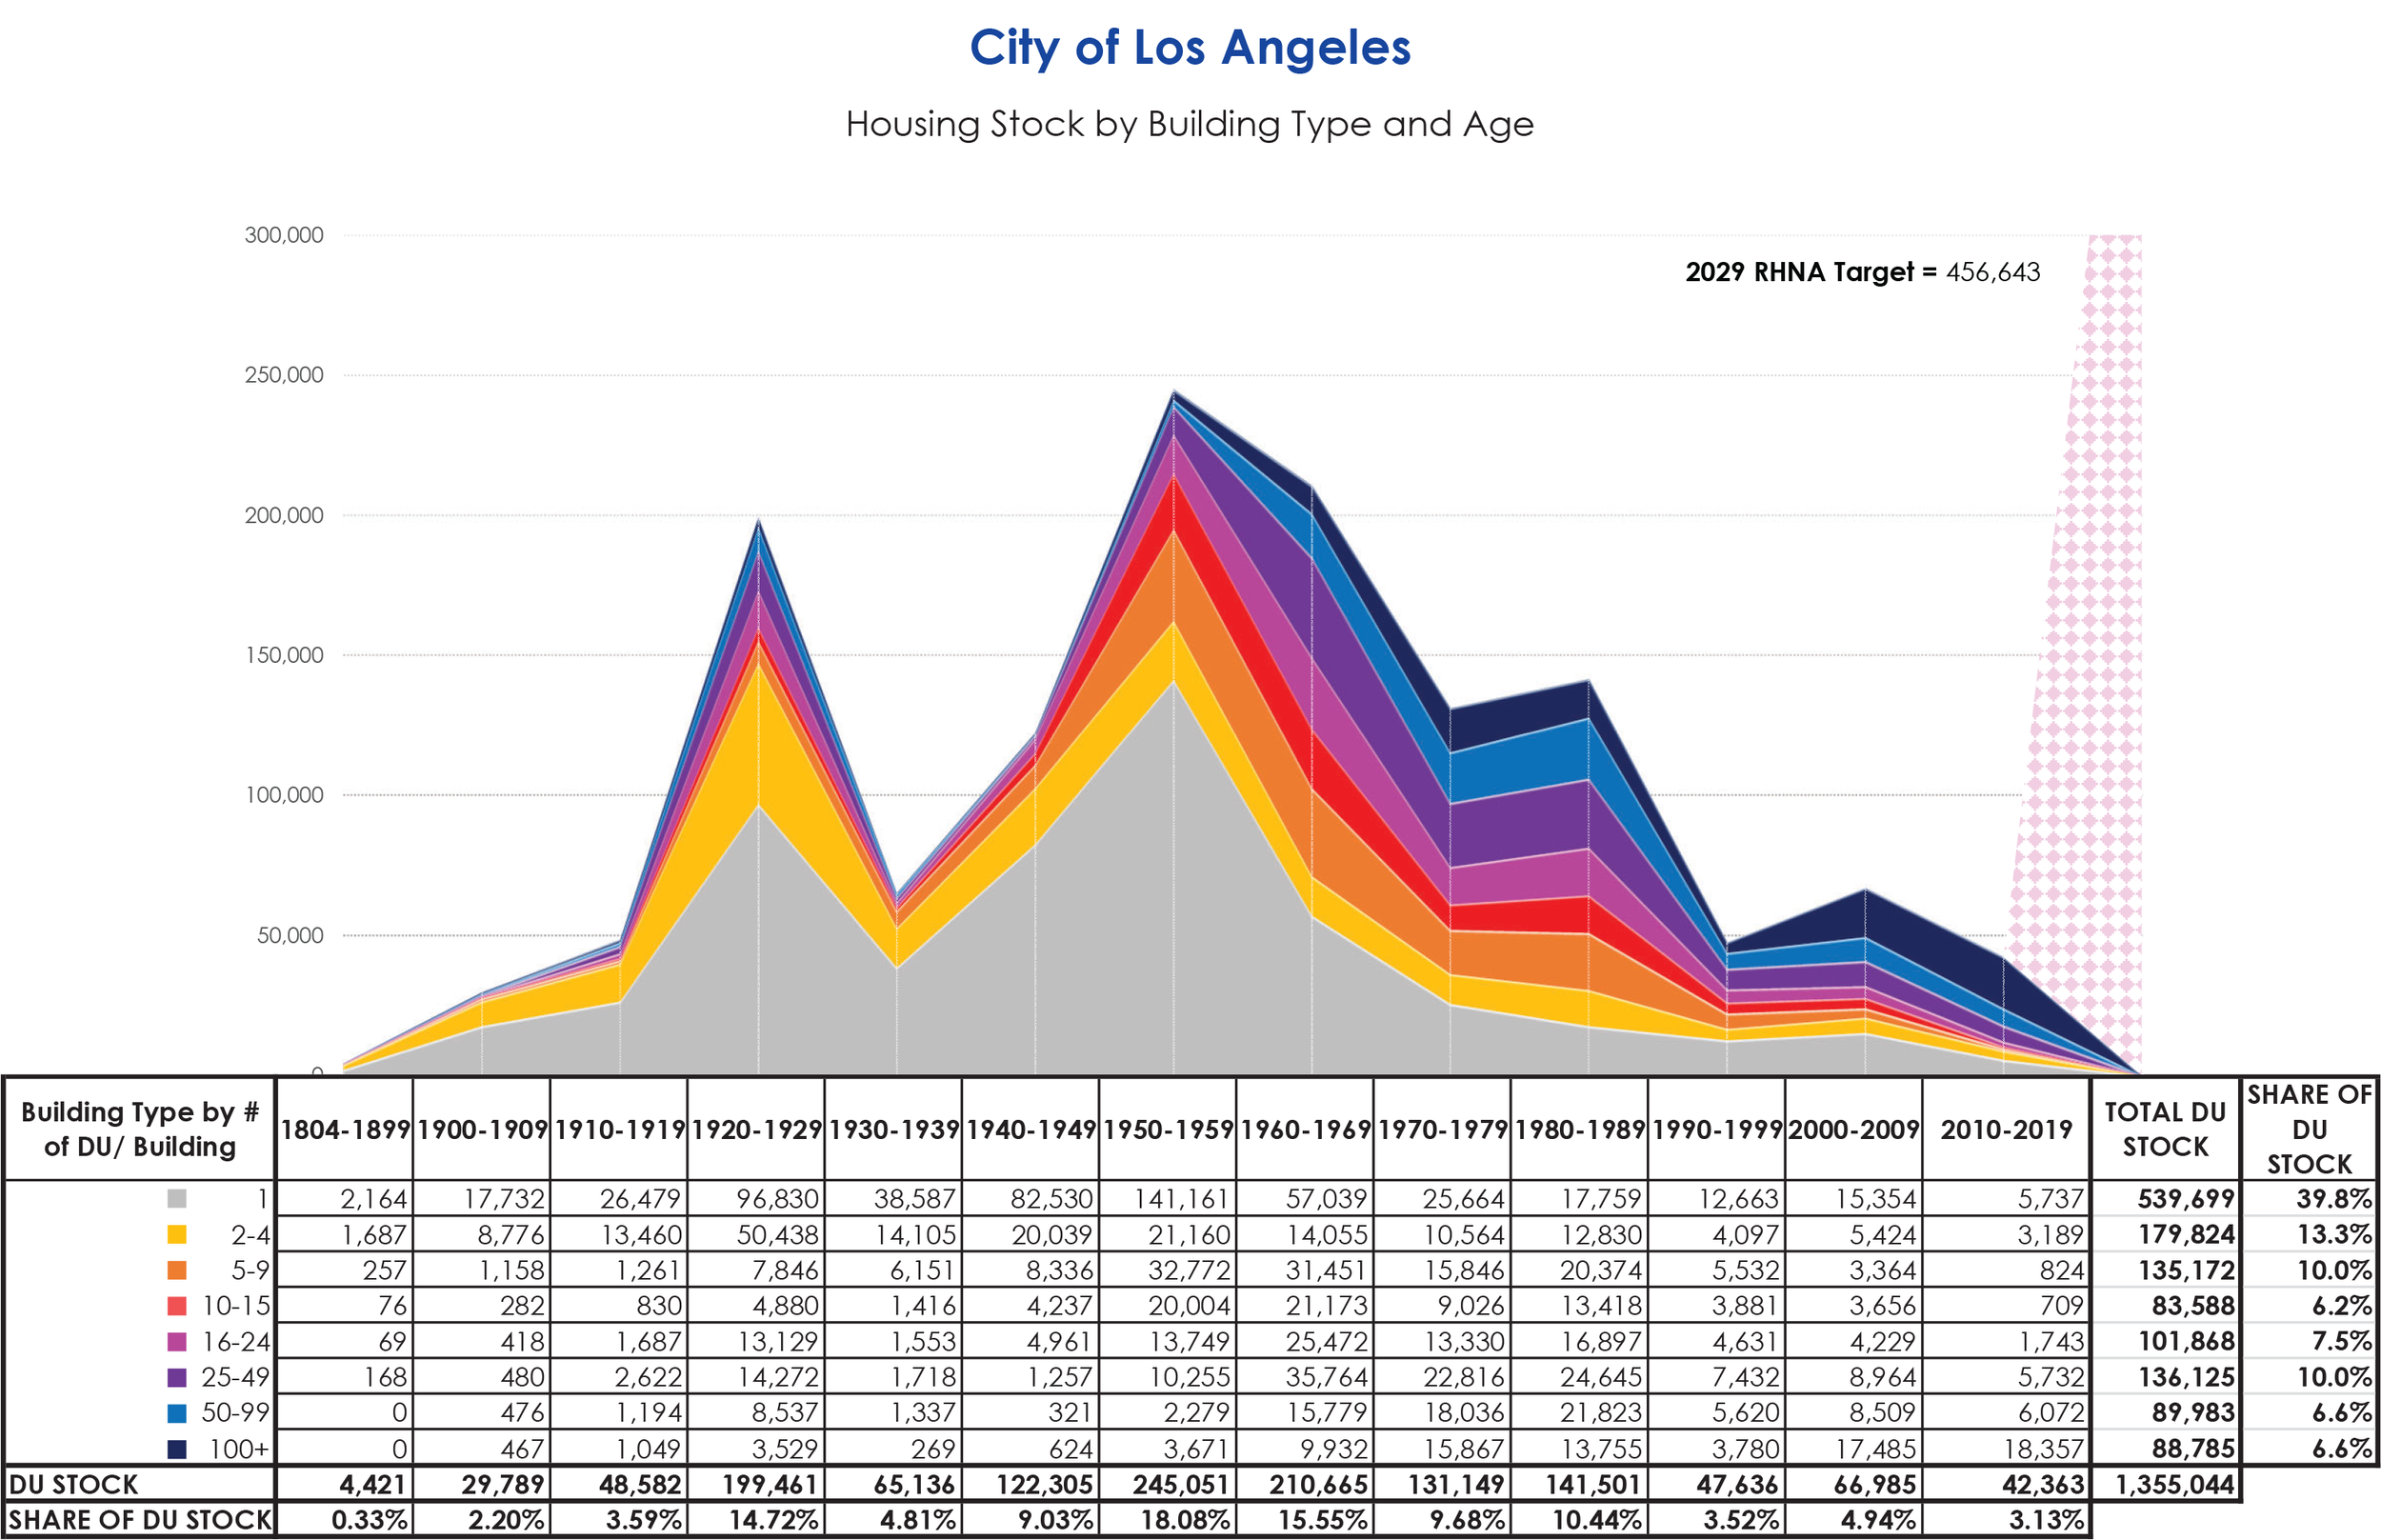
The City of Los Angeles is required to produce 450,000 net new dwelling units between 2021 to 2029 (California Department of Housing and Community Development [HCD], 2021). Divided evenly across eight years, the requirement represents approximately 56,000 net new Certificates of Occupancy annually. Despite inclusionary incentive programs intended to stimulate development, recent production has not approached this level. Long term housing production data show that, since the 1990s, annual completions in Los Angeles have remained below levels recorded during the Great Depression (Taylor, 2015; California Department of Housing and Community Development, 2017). The result is a persistent pattern of underproduction relative to population growth and economic demand embedded in adopted land use policy (Lewis, 2003; Ling, 2018).
This study evaluates whether housing can be delivered at the magnitude required to meet the housing target under two supply mechanisms: Accessory Dwelling Units and redevelopment along major boulevards. Conventional wisdom holds that ADUs provide scalable incremental infill, while boulevards provide concentrated vertical capacity without widespread neighborhood change. Both positions assume that existing land and existing regulatory tools are sufficient (Knaap et al., 2007; Kendall & Tulip, 2018).
The analysis proceeds in two parts. First, it evaluates whether ADUs can meet the housing target under observed production trends. Second, it calculates the building height required along boulevards for corridor land to contain sufficient spatial capacity to absorb assigned unit counts.
Los Angeles does not lack land area. The operative questions are the vertical intensity required and the annual production level necessary to deliver 450,000 net new dwelling units within eight years.
II. Methods
This study evaluates whether Accessory Dwelling Units and redevelopment along major boulevards can generate sufficient net new dwelling units to meet the 2021 to 2029 housing target within the defined planning cycle. The analysis is parcel scale and spatially modeled, combining geospatial land base calculations with observed production data to translate regulatory capacity into quantifiable unit yield.
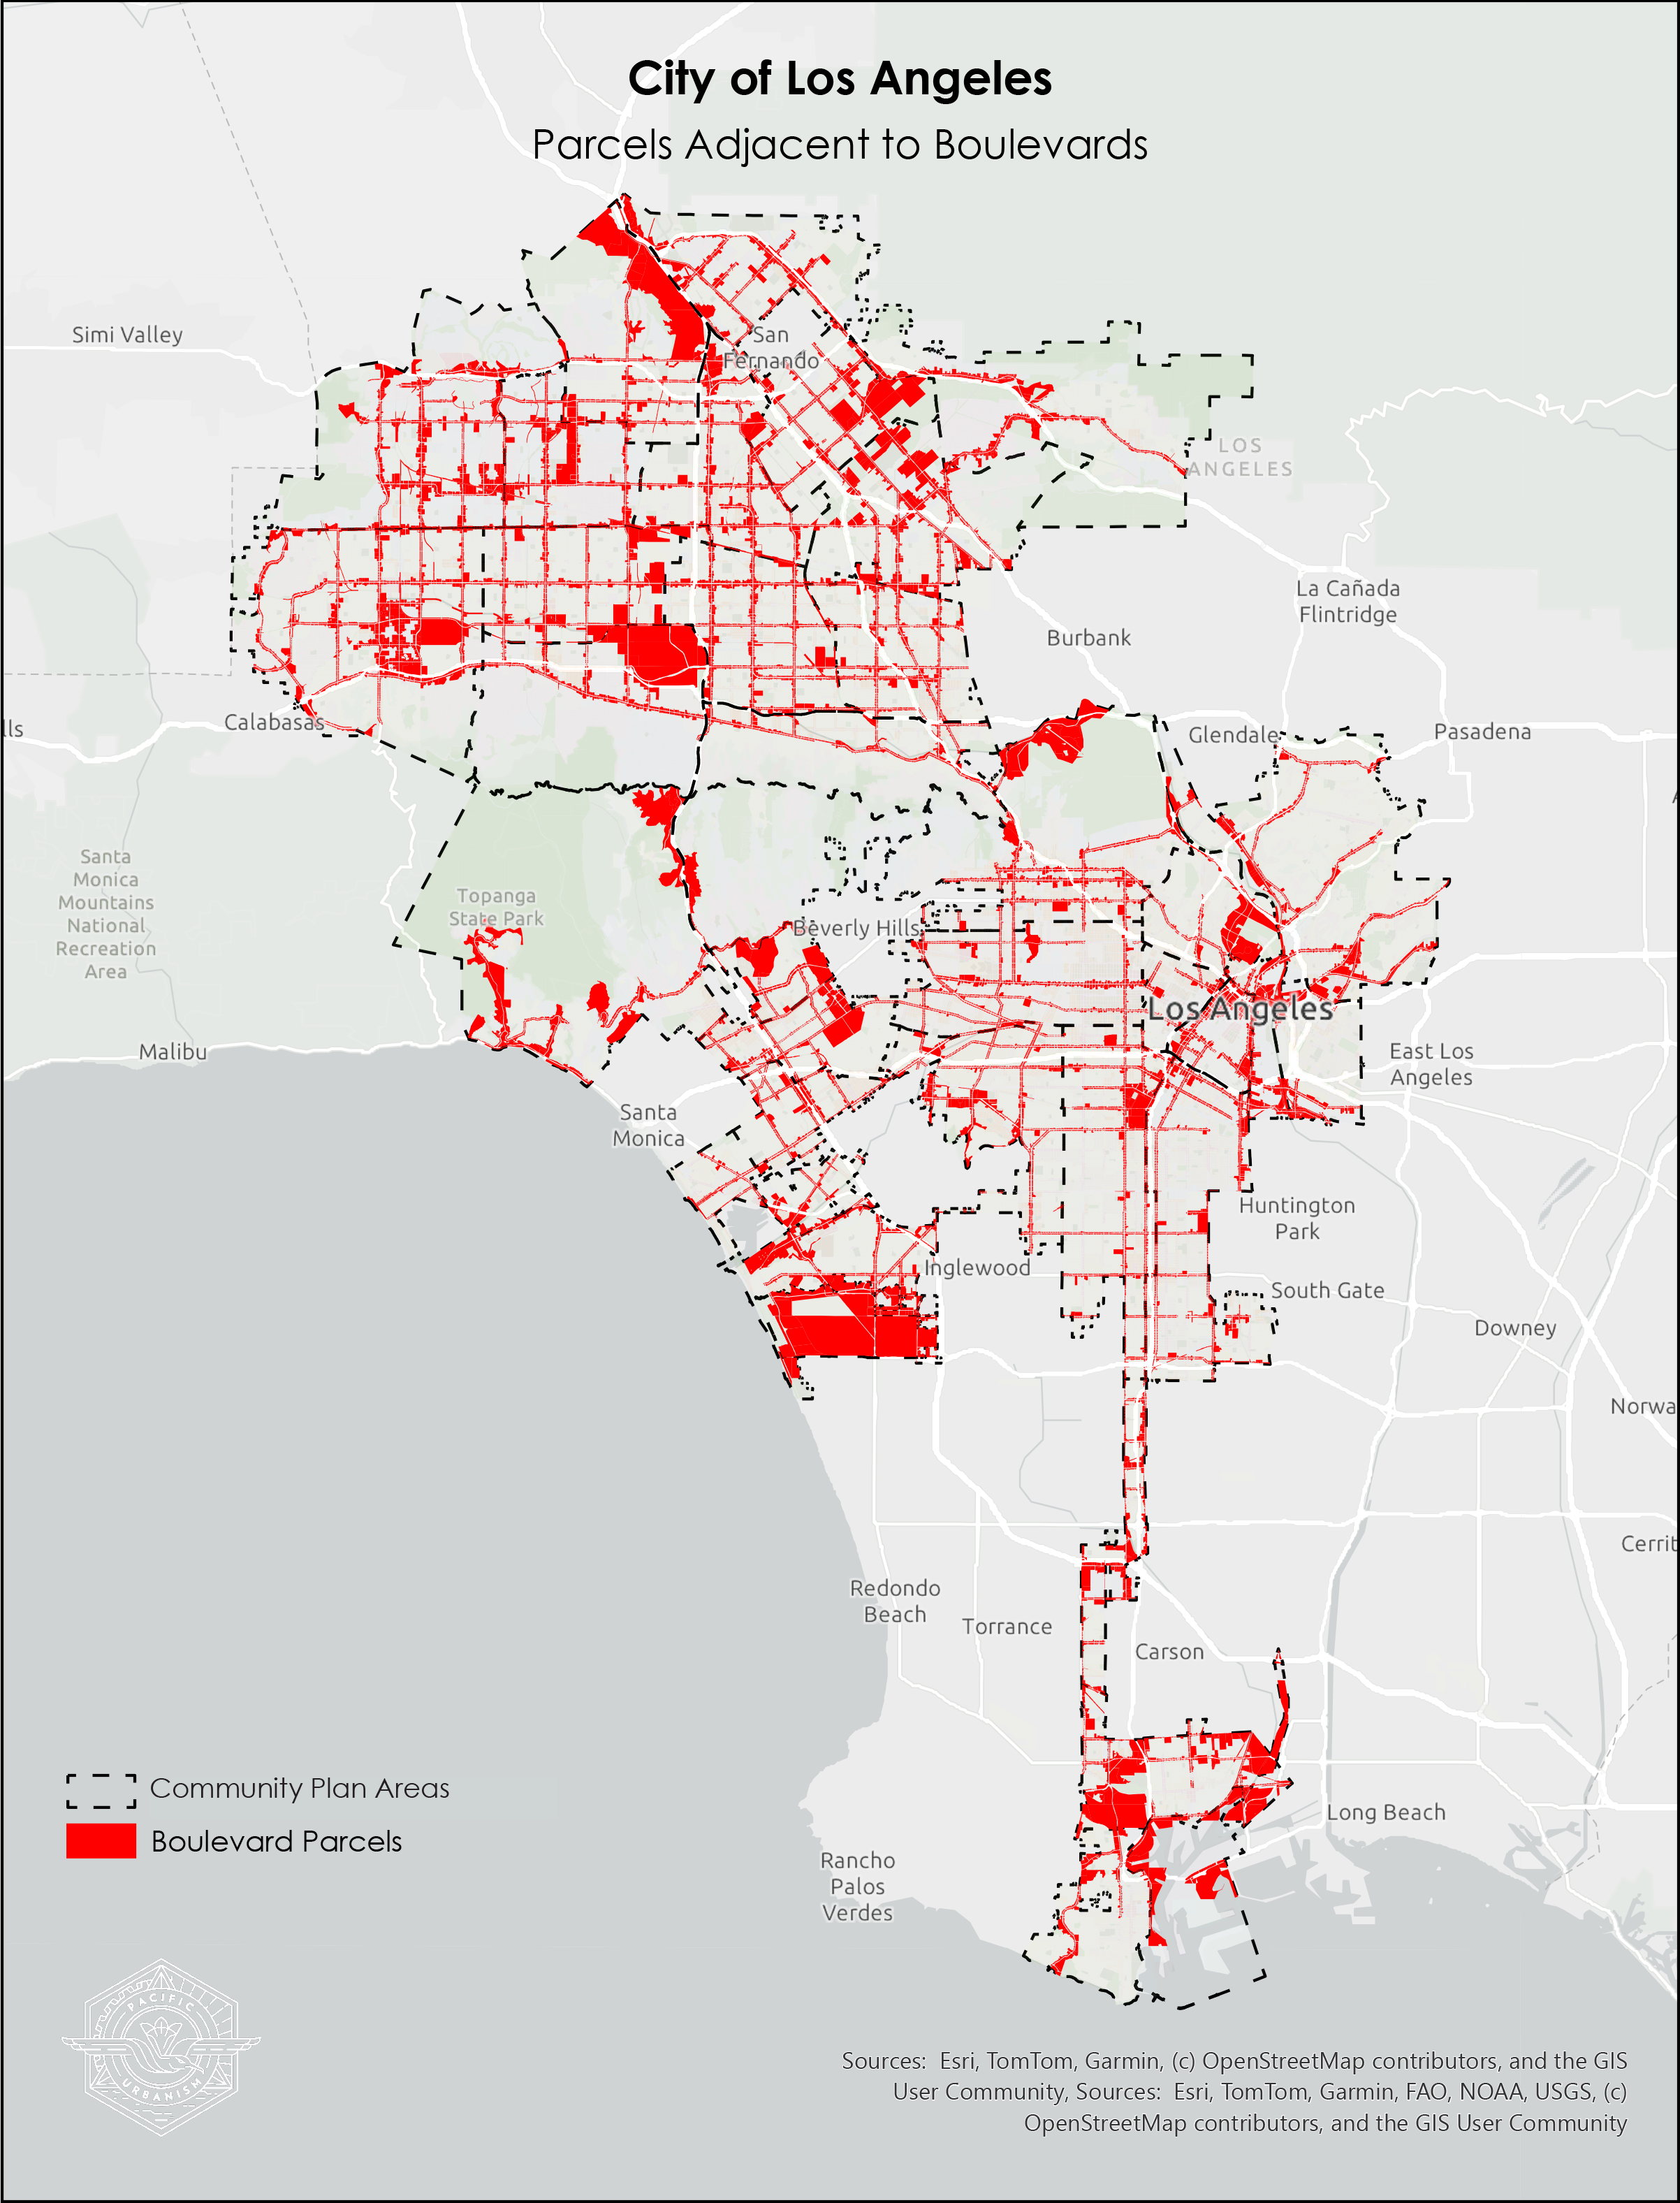
Parcel geometry, land use designations, and street centerline datasets were processed in ESRI ArcGIS Pro. Spatial joins linked Certificates of Occupancy to individual parcels, and 100 foot adjacency buffers defined boulevard frontage parcels. Parcel level filters excluded ineligible sites, including parcels containing existing buildings of four stories or greater.
Production was measured exclusively as net new Certificates of Occupancy. Permit issuance and entitlement approvals were excluded. Required annual production was calculated by dividing the assigned requirement of 450,000 net new dwelling units by the eight year planning cycle (HCD, 2021). The annual production gap was calculated as the difference between required annual Certificates of Occupancy and observed annual Certificates of Occupancy.
Data Sources
Parcel boundaries and Assessor Identification Number data were obtained from the County of Los Angeles Office of the Assessor tax roll dataset (County of Los Angeles Office of the Assessor, 2024) and corresponding parcel GIS shapefiles from the Los Angeles County GIS Data Portal (County of Los Angeles, 2024).
Building footprint and building attribute shapefiles were obtained from the City of Los Angeles Open Data Portal (City of Los Angeles, 2024a).
Certificates of Occupancy and permit records were obtained from the City of Los Angeles Open Data Portal, including datasets maintained by the Department of Building and Safety (City of Los Angeles, 2024b).
Street centerline data used to generate 100 foot boulevard adjacency buffers were obtained from the City of Los Angeles GeoHub (City of Los Angeles Bureau of Engineering, 2023).
Community Plan Area boundary shapefiles were obtained from the Los Angeles Department of City Planning GIS portal (City of Los Angeles Department of City Planning, 2023).
The 2021 to 2029 Regional Housing Needs Allocation assignment for the City of Los Angeles was obtained from the California Department of Housing and Community Development (California Department of Housing and Community Development, 2021).

III. Results
A. Accessory Dwelling Units
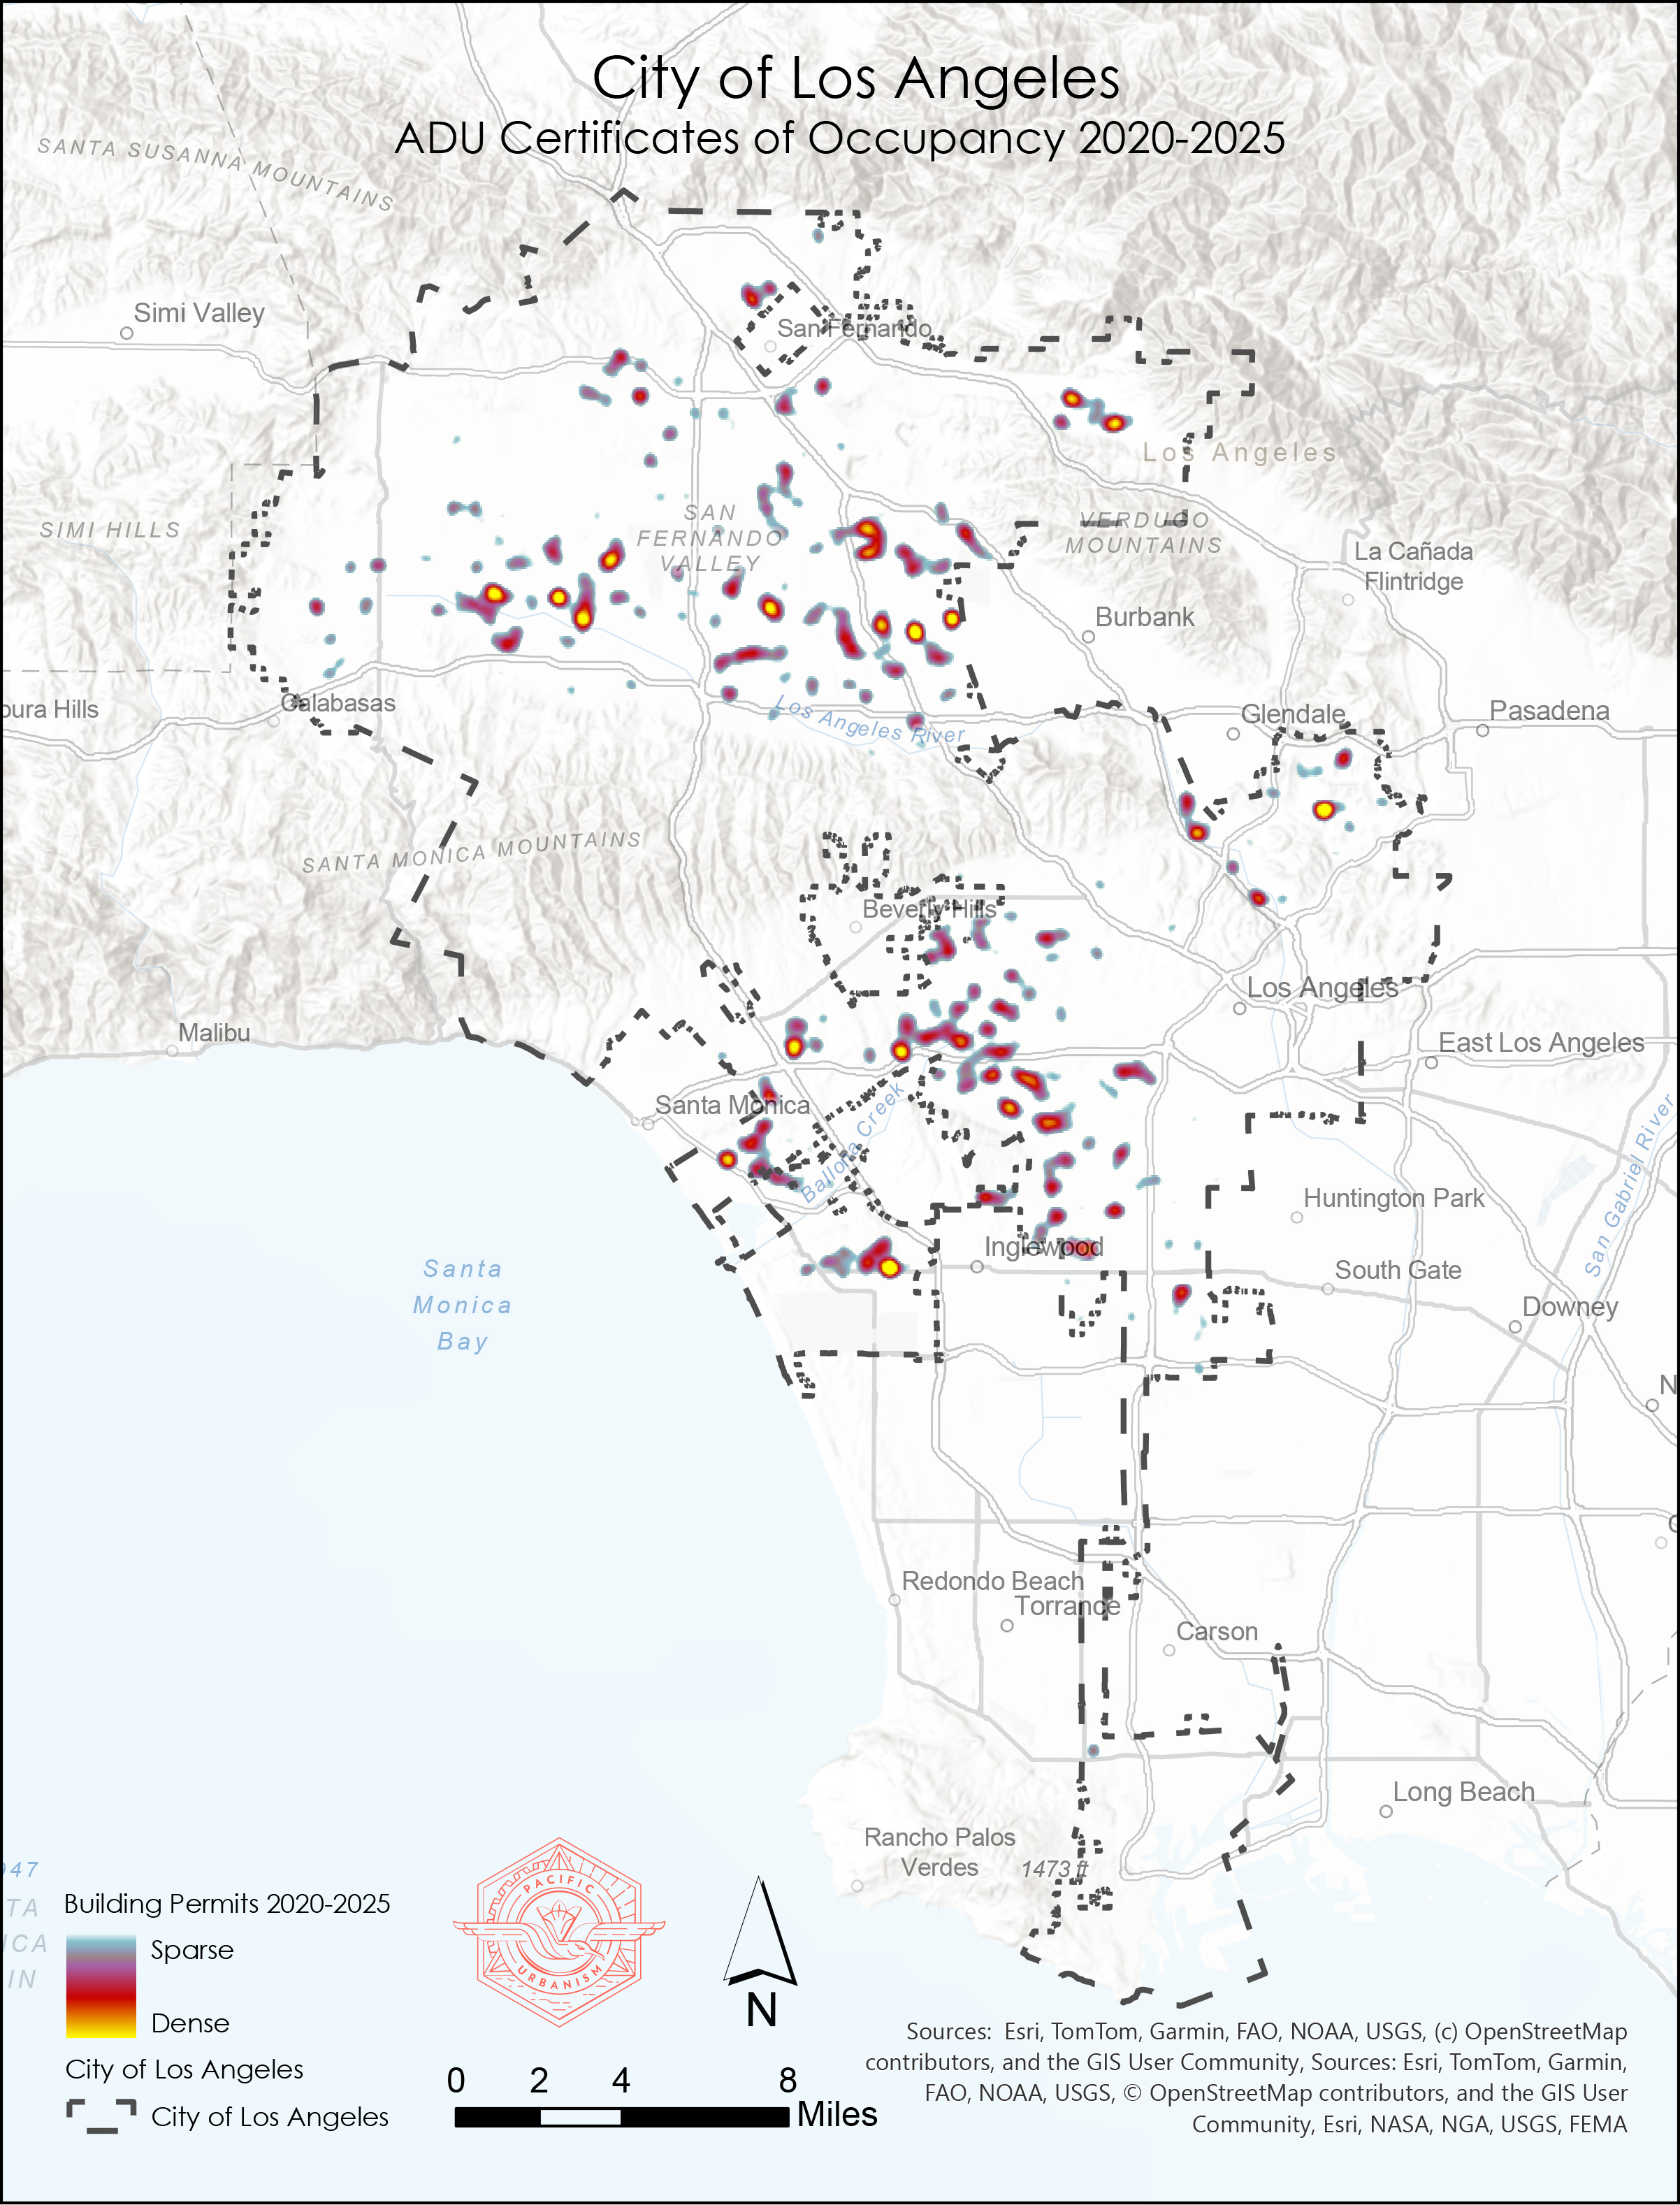
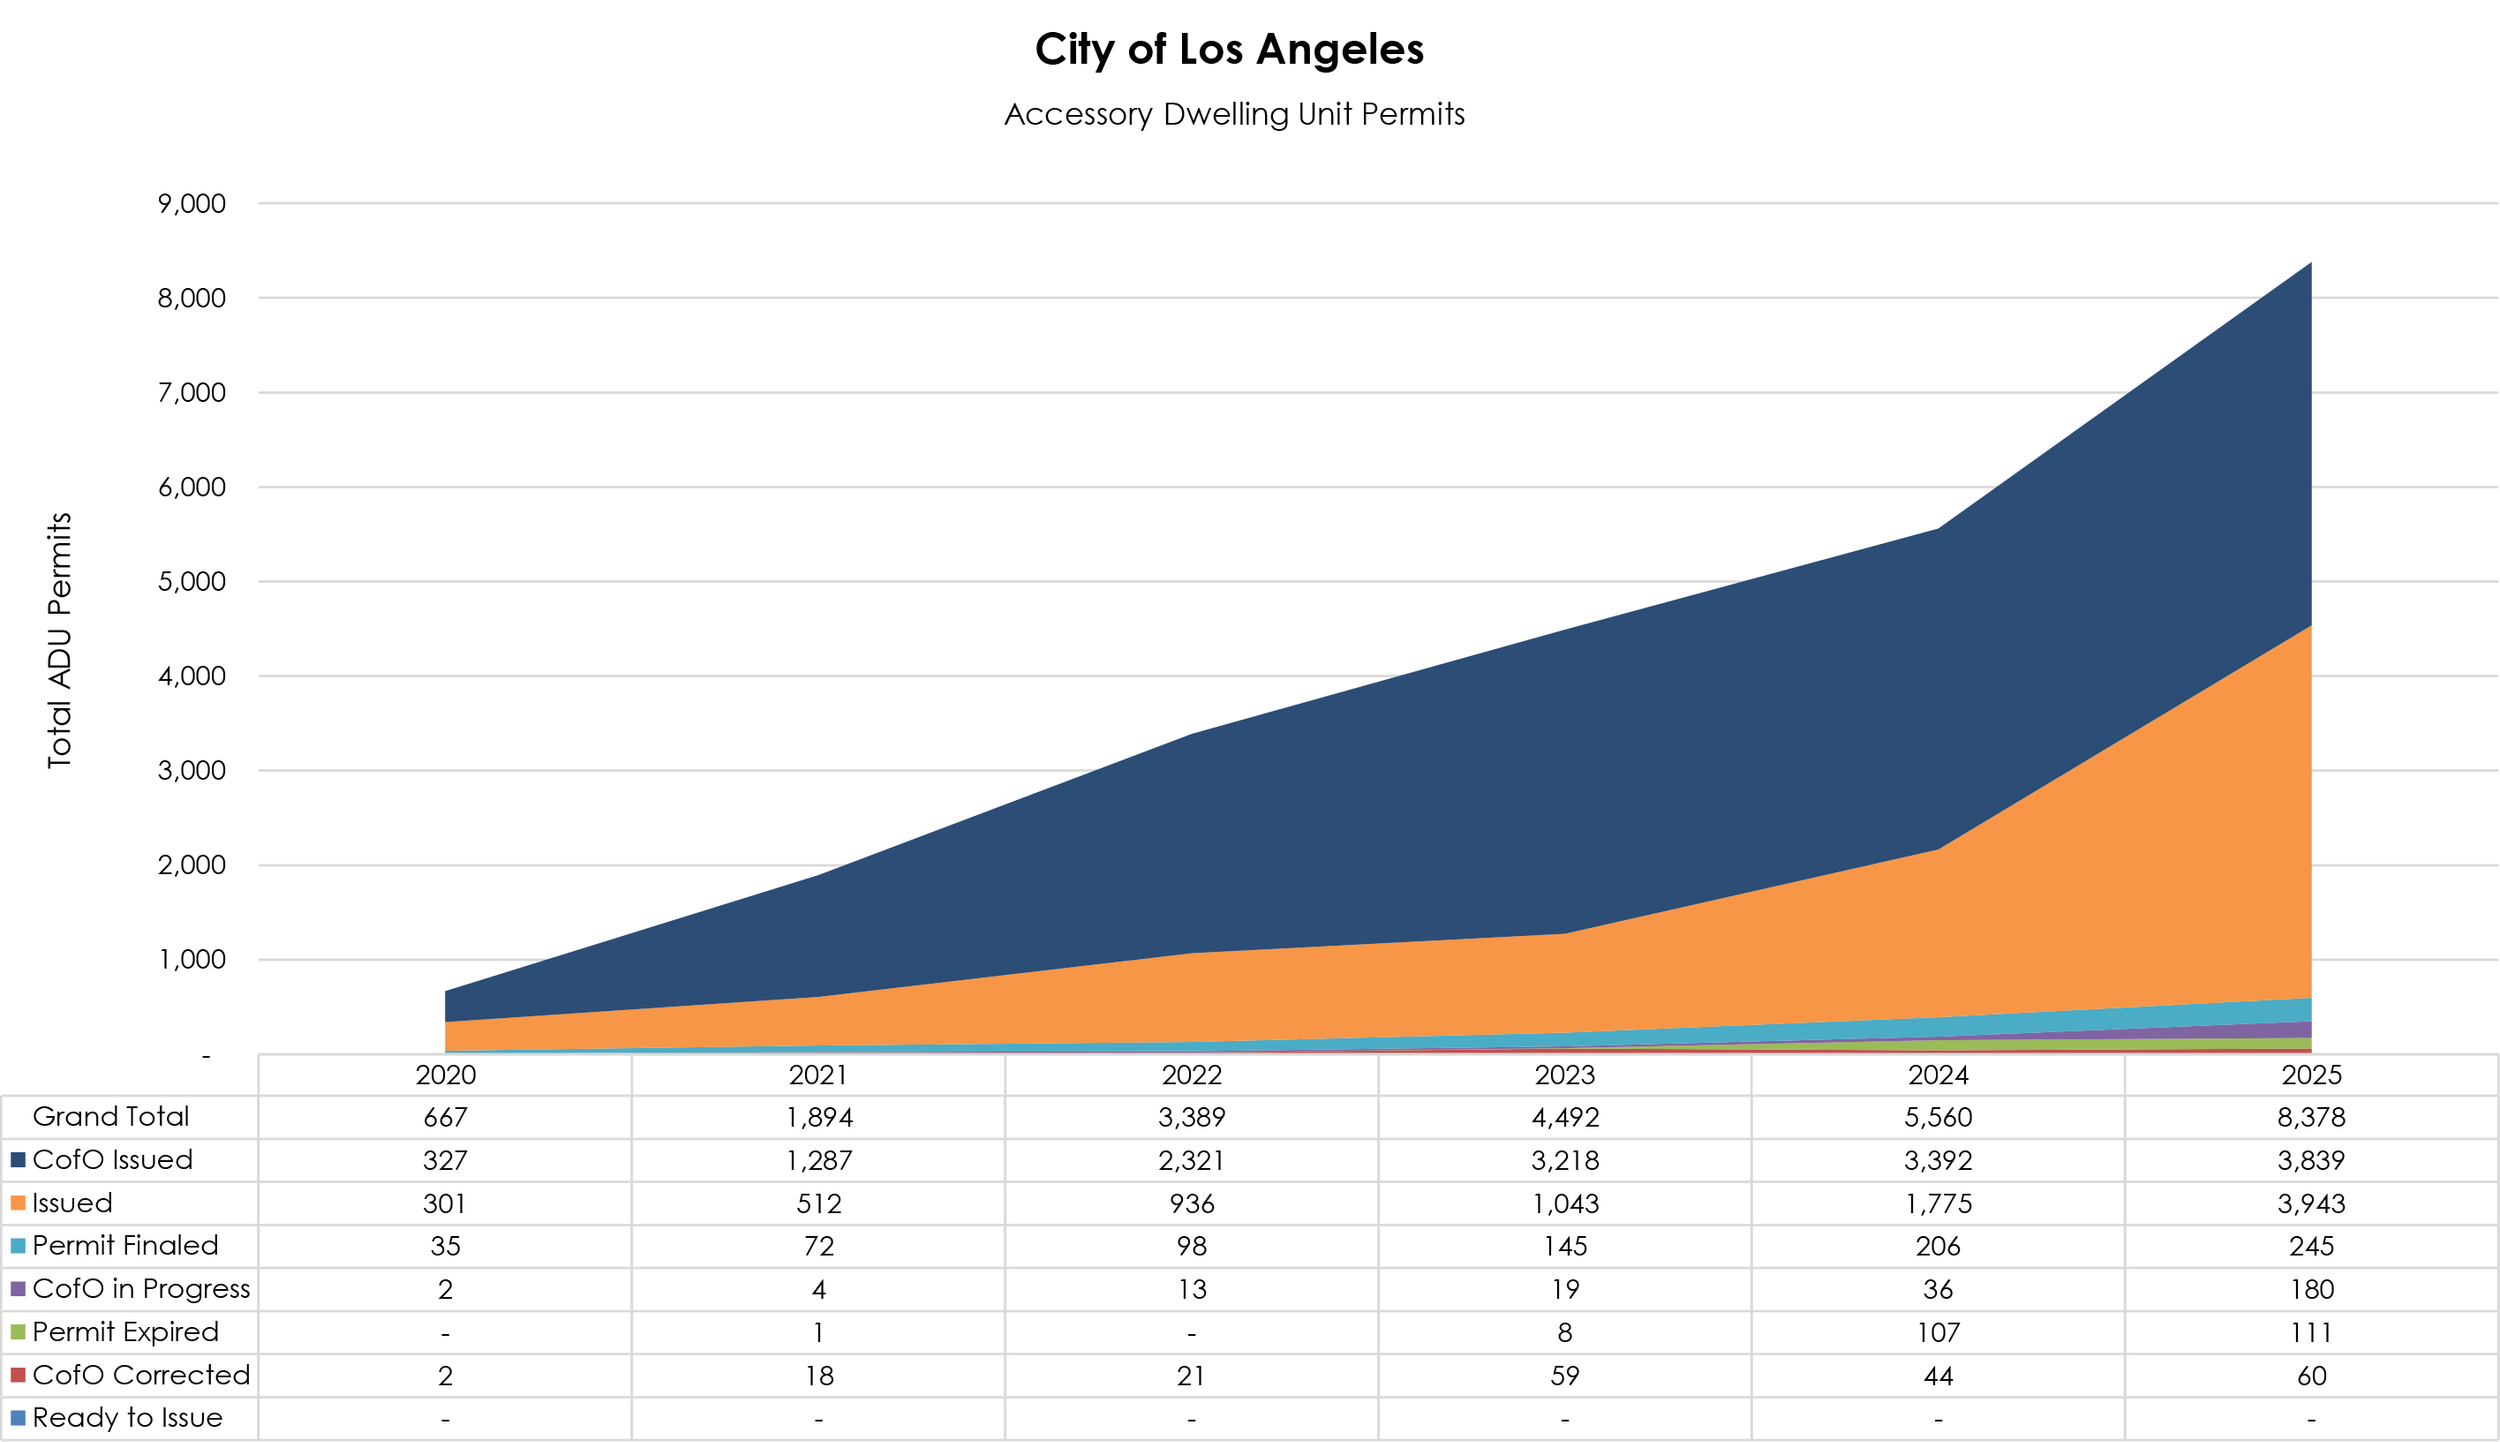
Between 2020 to 2025, ADU Certificates of Occupancy in the City of Los Angeles increased from 327 to 3,839, representing a compound annual growth rate of approximately 64 percent. In the Venice Community Plan Area, ADU Certificates of Occupancy increased from 3 to 43 over the same period, reflecting a compound annual growth rate of approximately 71 percent.
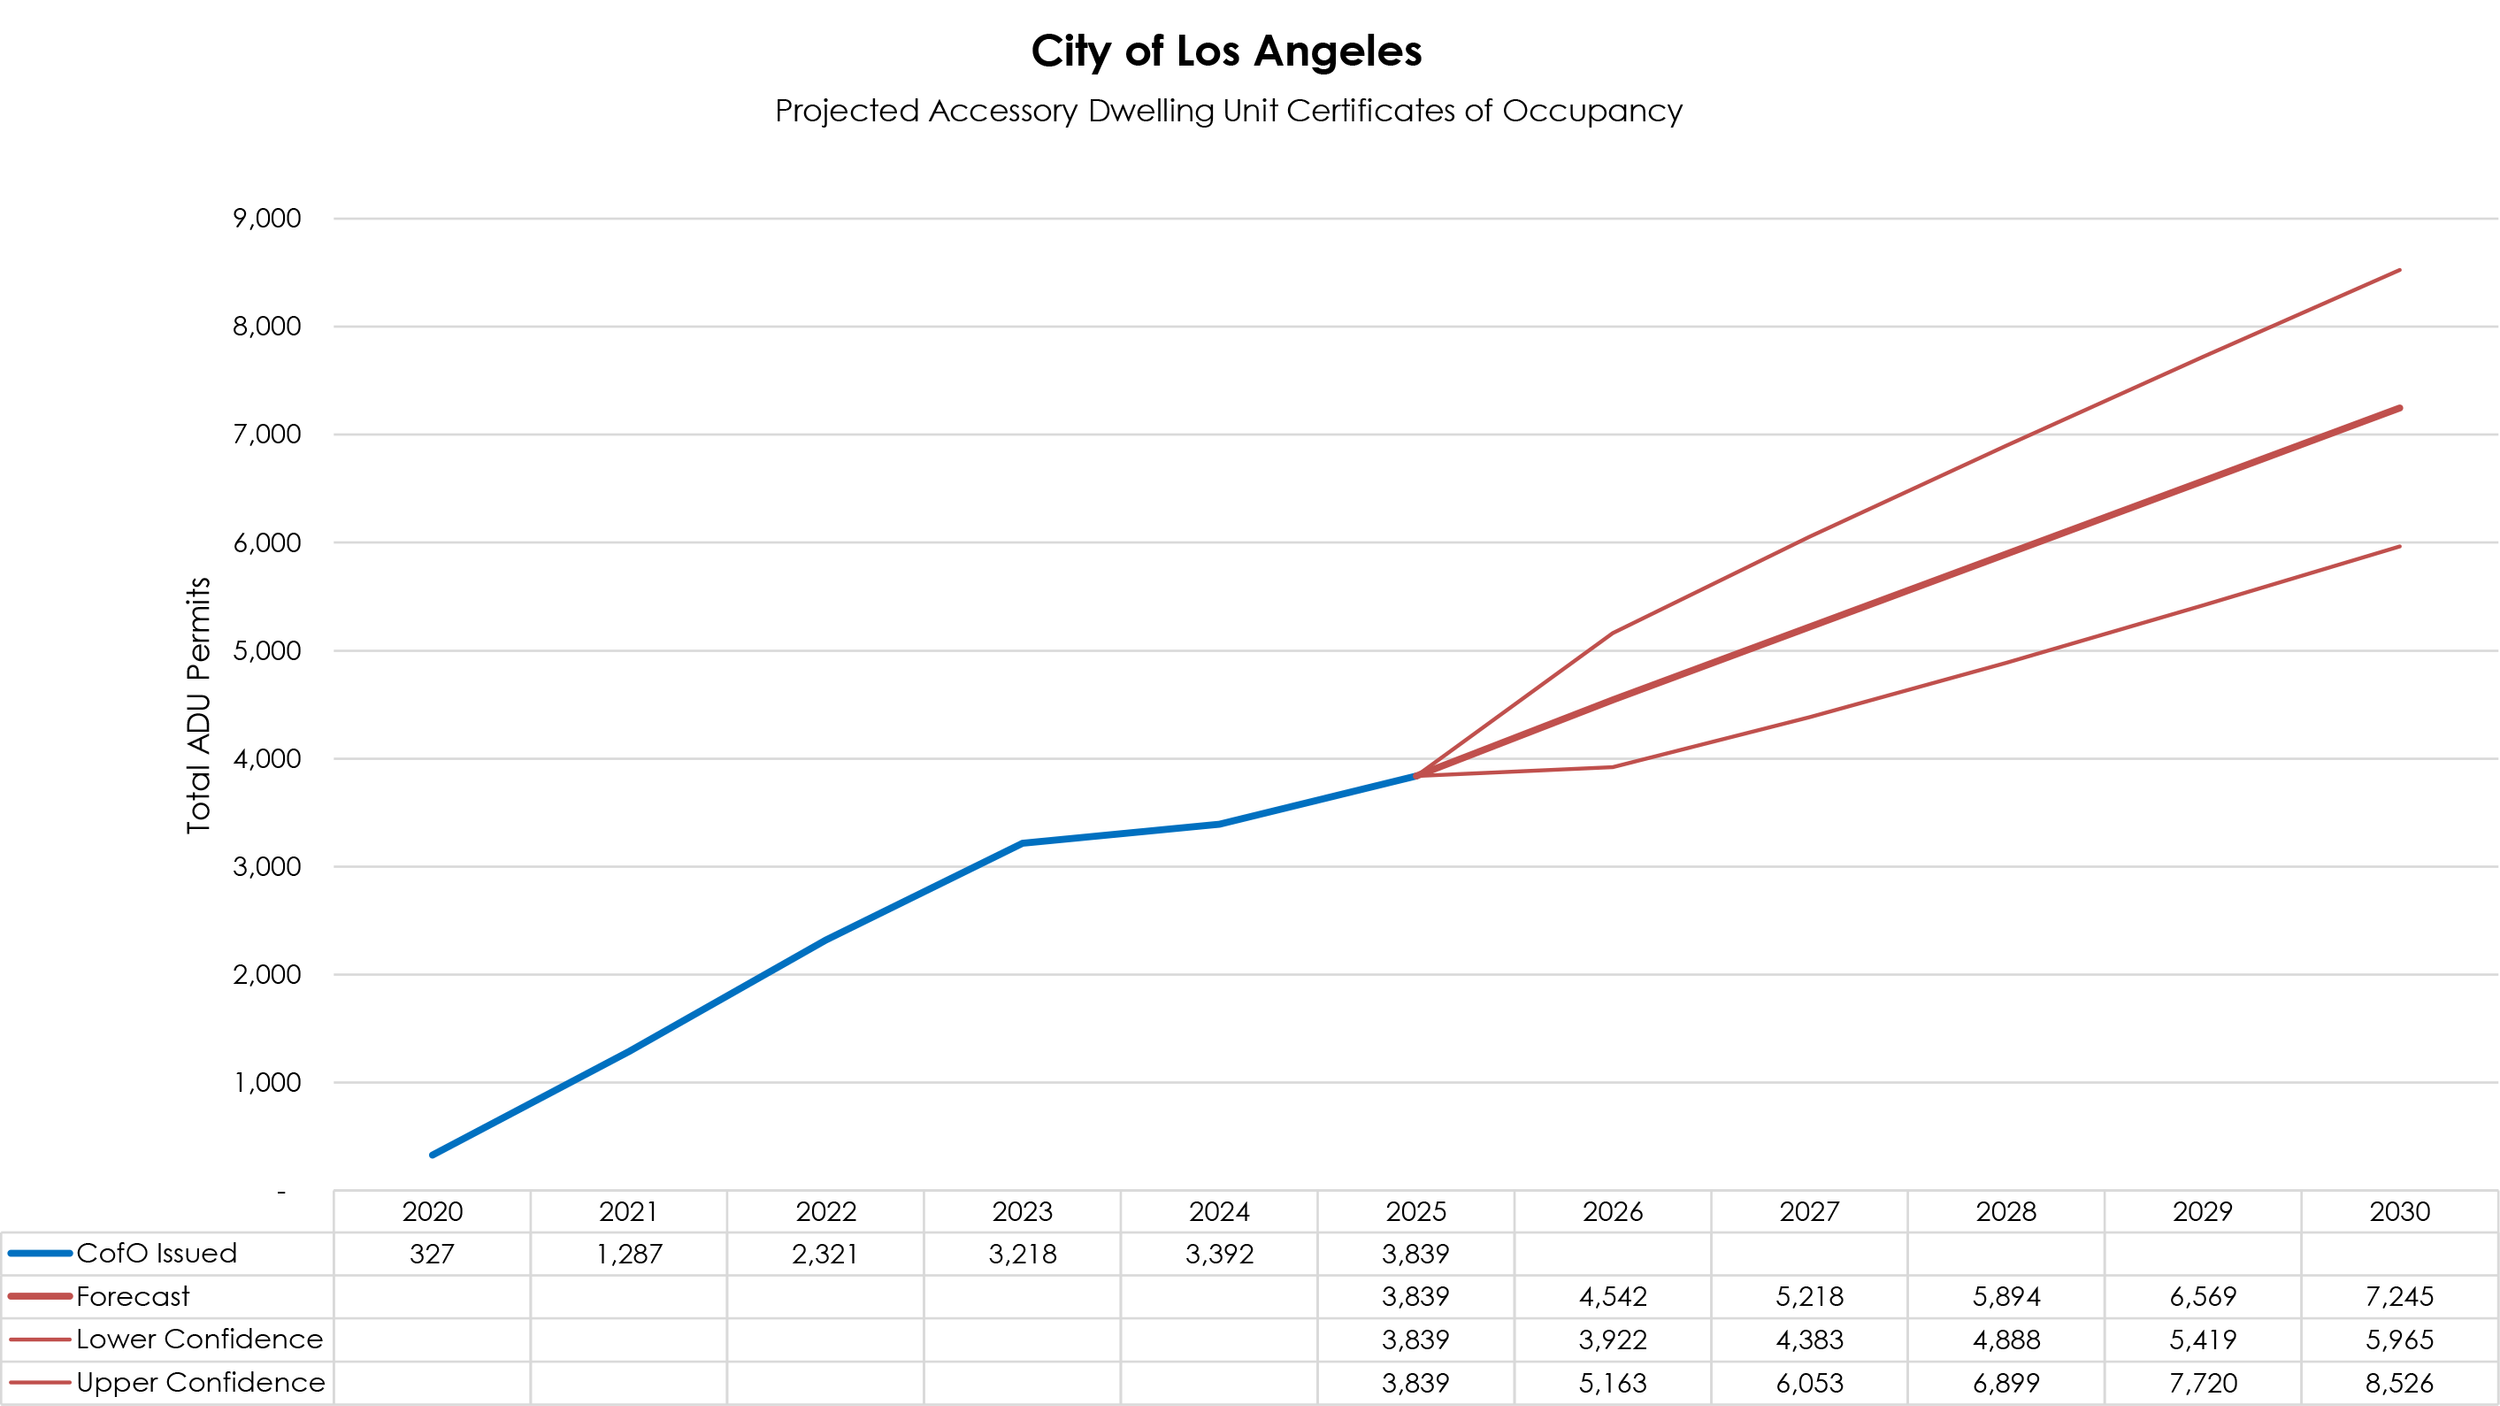
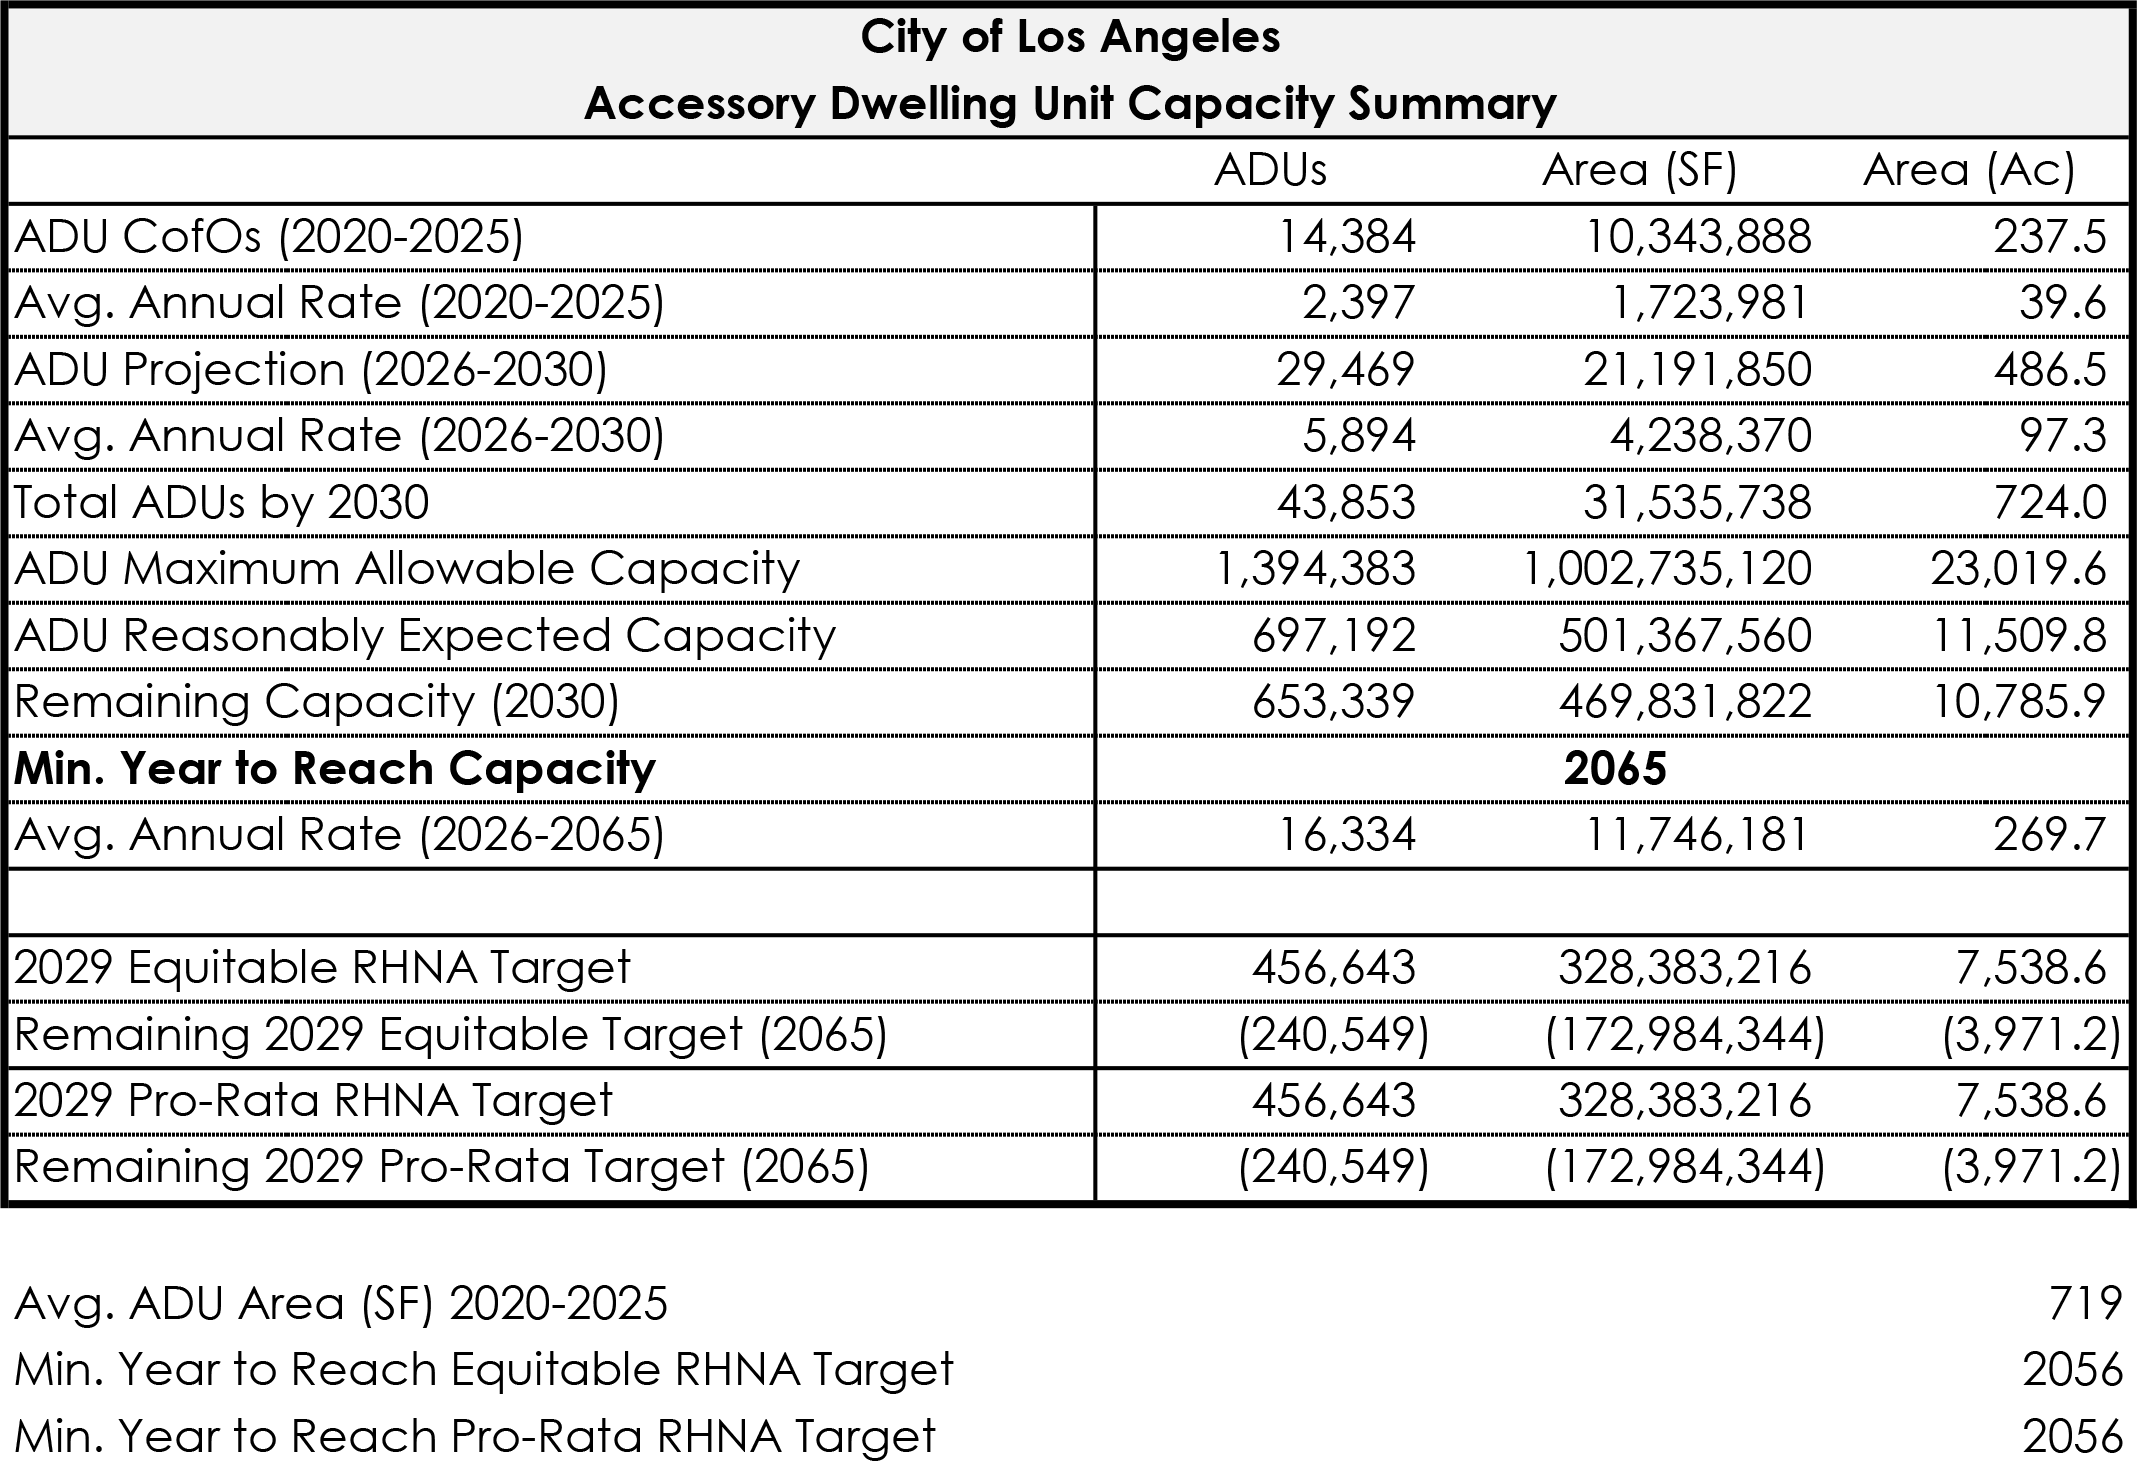
At the citywide scale, continuation of recent growth yields cumulative ADU production through 2029 in the range of approximately 40,000 to 50,000 units. This represents approximately one tenth of the 450,000 unit housing target (HCD, 2021).
Meeting the full allocation through ADUs alone would require annual production levels roughly nine to ten times recent output.
B. Boulevards
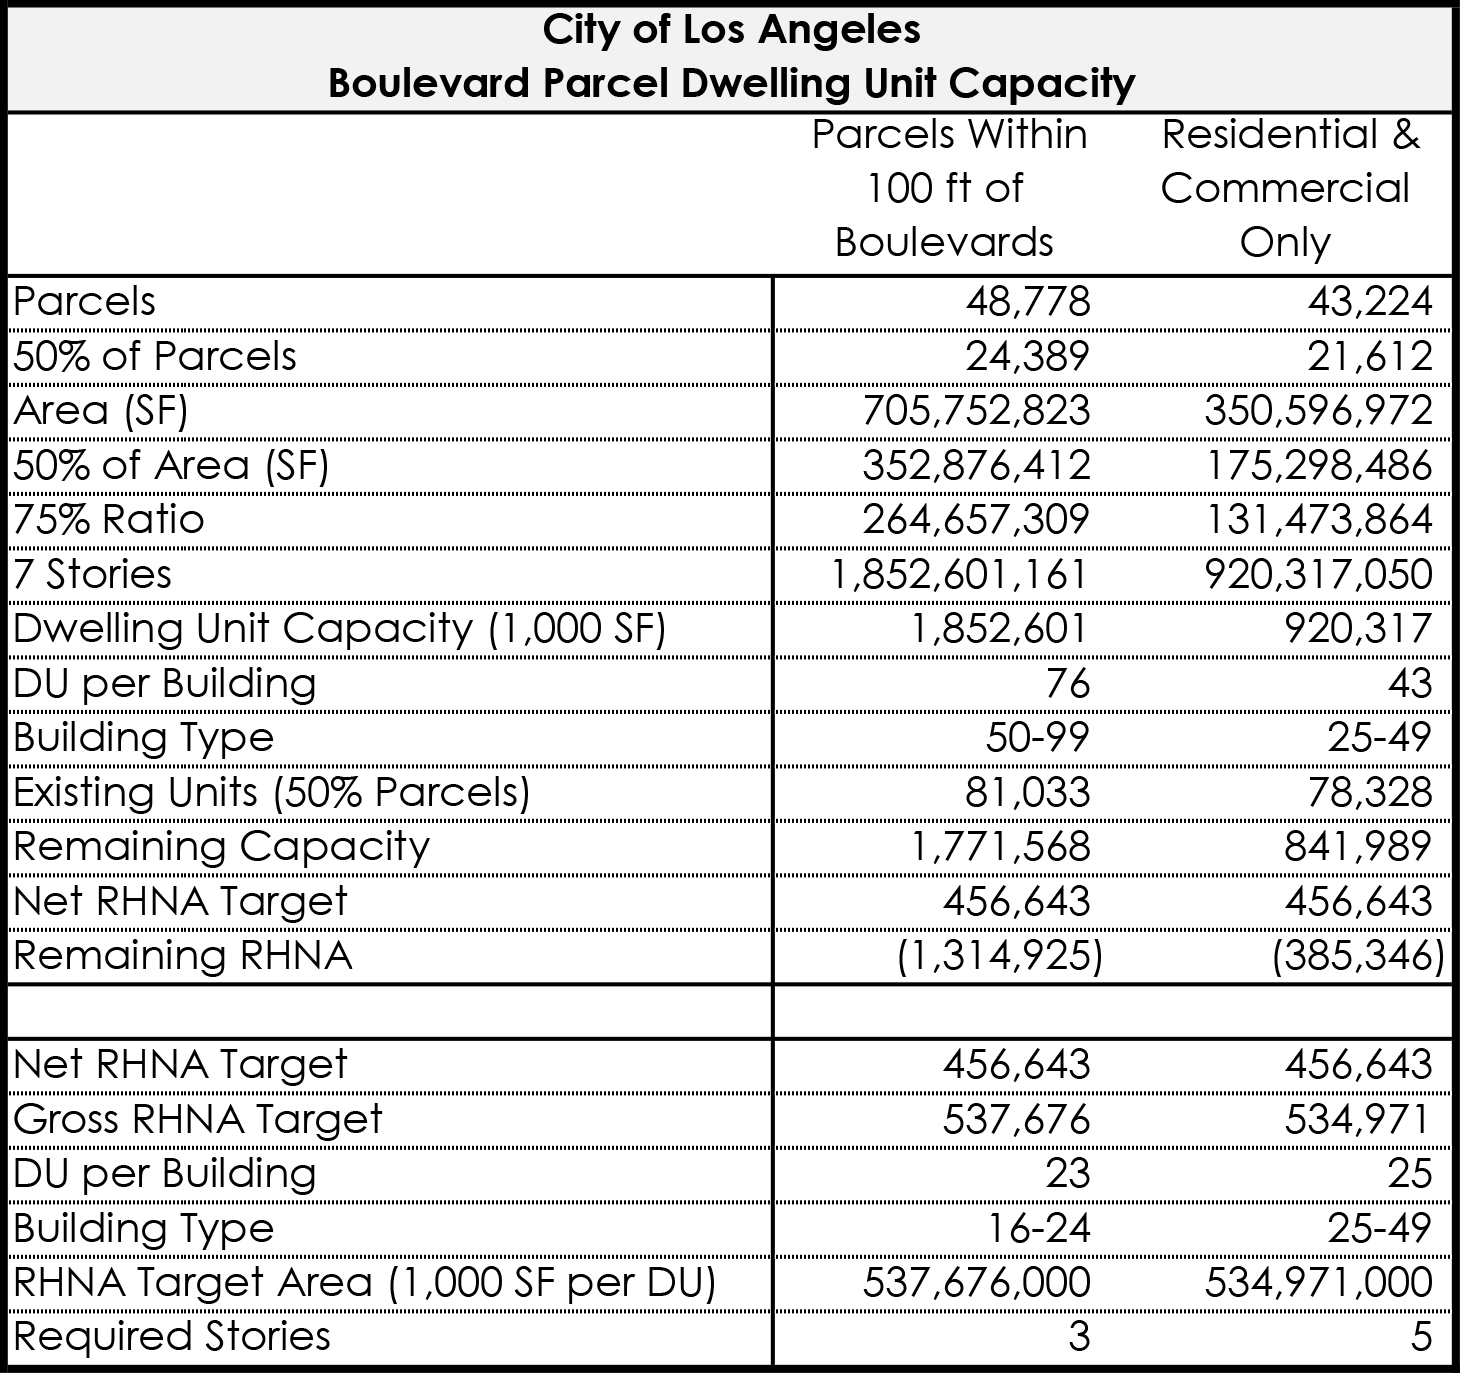
When the redevelopment pool is limited to parcels currently zoned residential and commercial, required average built height varies substantially across Community Plan Areas. Citywide, modeled height ranges from approximately 2 stories in lower allocation areas to 33 stories in the most constrained areas.
In the Venice Community Plan Area, the required average built height across participating boulevard parcels is approximately 20 stories.
IV. Discussion
A. The Production Gap Under Current Zoning
The assigned housing target corresponds to a required annual production threshold of approximately 56,000 net new Certificates of Occupancy (HCD, 2021). Recent output remains materially below that level. When annual completions fall short, the remaining required production increases in subsequent years.
Under observed trajectories, neither ADUs nor boulevard redevelopment produce housing at a rate sufficient to meet the 2021 to 2029 allocation within the planning cycle. The shortfall corresponds directly to the dwelling unit density and building height currently authorized under zoning (Kendall & Tulip, 2018; Knaap et al., 2007).
Closing the gap requires revisiting the conditions that determine how much housing is legally permitted and at what intensity (Elmendorf et al., 2019).
B. Zoning Capacity and Built Reality
Parcel level modeling demonstrates that boulevard land contains sufficient area to accommodate required residential floor area under stated assumptions. The limiting variable is the dwelling unit density and building height authorized on that land.
Where allowable height falls below modeled required height, the housing target cannot be met on those corridors within the planning cycle. This relationship between zoning restriction and housing supply is consistent with empirical research demonstrating that regulatory limits constrain production and increase housing costs (Kendall & Tulip, 2018; Taylor, 2015).
C. Intensity and Annual Output
Annual production is bounded by the dwelling unit yield and building height authorized through entitlement. Where zoning limits intensity below modeled required levels, compliance is constrained by adopted regulation (Lewis, 2003; Ling, 2018).
D. Implications for Land Use Policy
A single citywide zoning standard cannot accommodate Community Plan Areas with materially different allocations and materially different corridor land bases. Housing Element compliance research demonstrates that local implementation choices determine whether state assigned allocations translate into realized production (Lewis, 2003; Ling, 2018).
Where zoning envelopes cap height or floor area below modeled required intensity, the shortfall is embedded in the code. Certificates of Occupancy cannot exceed what entitlement permits.
V. Conclusion
This study evaluated whether ADUs and boulevard redevelopment can meet Los Angeles’ 2021 to 2029 housing target within the planning cycle.
ADUs have expanded materially and demonstrate homeowner participation under reformed regulations. Even under sustained compound growth, their cumulative yield remains a limited share of the citywide obligation.
Boulevard redevelopment operates at a larger scale. Translating Community Plan Area allocations into required floor area and distributing that requirement across participation adjusted corridor parcels produces distinct height thresholds in each area. In higher allocation areas, including Venice, required averages exceed twenty stories.
Los Angeles possesses sufficient corridor land area to accommodate its allocation, yet it lacks zoning envelopes that authorize the dwelling unit density and building height required to meet that obligation. When adopted land use regulations permit intensity below levels derived from the assigned allocation, the resulting shortfall is the predictable outcome of legislative decisions. Compliance within the planning period depends on whether allowable density and height are recalibrated to reflect the arithmetic of the allocation. Where zoning remains below modeled required intensity, noncompliance is embedded in the adopted code itself.
END NOTES
California Department of Housing and Community Development. 2021 to 2029 Regional Housing Needs Allocation assignment for the City of Los Angeles: 456,643 net new dwelling units. For clarity of discussion, this paper refers to this figure as 450,000 net new dwelling units.
Compound annual growth rate is calculated using the standard formula:
CAGR = (Ending Value ÷ Beginning Value)^(1 ÷ Years) − 1.Parcel level eligibility analysis indicates that ADU capacity in Venice is not constrained by lack of eligible sites. Theoretical buildout under current regulations, adjusted to 50 percent participation to reflect Reasonably Expected Development, yields participation adjusted capacity substantially above the approximately 477 cumulative units projected by 2030. The limiting factor is annual completion rate, not parcel supply.
The Housing Allocation Index allocates assigned Regional Housing Needs Allocation targets to Community Plan Areas based on proportional dwelling unit share and adjusted capacity metrics. Pro Rata by Dwelling Units distributes the citywide assignment proportionally according to each Community Plan Area’s existing dwelling unit inventory, creating a baseline comparison between equitable redistribution and proportional allocation. Both methods are internal analytical frameworks developed by the Center for Pacific Urbanism and applied across parcel level capacity modeling.
References
American Planning Association. (2019). Housing policy guide. American Planning Association.
California Department of Housing and Community Development. (2017). California’s housing future: Challenges and opportunities. State of California.
California Department of Housing and Community Development. (2021). Regional housing needs allocation 2021 to 2029: City of Los Angeles allocation. State of California.
City of Los Angeles. (2024a). Building footprint dataset. LA Open Data Portal. https://data.lacity.org
City of Los Angeles. (2024b). Certificates of occupancy and permit dataset. LA Open Data Portal. https://data.lacity.org
City of Los Angeles Bureau of Engineering. (2023). Street centerline dataset. LA GeoHub. https://geohub.lacity.org
City of Los Angeles Department of City Planning. (2023). Community plan area boundaries dataset. https://planning.lacity.gov
County of Los Angeles. (2024). Parcel boundary GIS dataset. Los Angeles County GIS Data Portal. https://egis-lacounty.hub.arcgis.com
County of Los Angeles Office of the Assessor. (2024). Assessor parcel and tax roll data. https://assessor.lacounty.gov
Eikel, M. (1973). Zoning shall be consistent with the general plan. San Diego Law Review.
Elmendorf, C. S., Biber, E., Monkkonen, P., & O’Neill, M. (2019). Making it work: Legal foundations for administrative reform of California’s housing framework. UC Davis School of Law.
Housing Crisis Task Force. (2000). In short supply: Recommendations of the Los Angeles Housing Crisis Task Force. City of Los Angeles.
Kendall, R., & Tulip, P. (2018). The effect of zoning on housing prices. Reserve Bank of Australia.
Knaap, G., Meck, S., Moore, T., & Parker, R. (2007). Zoning as a barrier to multifamily housing development. American Planning Association.
Lewis, P. G. (2003). California’s housing element law: The issue of local compliance. Public Policy Institute of California.
Ling, S. (2018). How fair is fair share? A longitudinal assessment of California’s housing element law. UCLA.
Mischke, J., Peloquin, S., Weisfield, D., & Woetzel, J. (2016). Closing California’s housing gap. McKinsey Global Institute.
Morrow, G. (2013). The homeowner revolution: Democracy, land use, and the Los Angeles slow growth movement, 1965 to 1992. UCLA.
Taylor, M. (2015). California’s high housing costs: Causes and consequences. Legislative Analyst’s Office.
Woetzel, J., et al. (2019). Affordable housing in Los Angeles: Delivering more and doing it faster. McKinsey Global Institute.