housing allocation index revisited
Continued planning for resilience, equity, and responsibility
Suggested Citation
Ricardo de la Rosa, L., Alvarez, D. (2025) Housing Allocation Index Revisited. Los Angeles, CA. Pacific Urbanism.
TOP 5 COMMUNITY PLAN AREAS BY ABILITY AND DESIRABILITY FOR NEW CONSTRUCTION

Every eight years, a housing production target is determined for the City of Los Angeles by the Southern California Association of Governments (SCAG) in their Regional Housing Needs Assessment (RHNA). In 2020, the Center for Pacific Urbanism published its Housing Allocation Index (HAI) and the resulting production targets for each of the City's thirty-five Community Plan Areas for the 2021-2029 RHNA cycle.
When the Center for Pacific Urbanism first published its Housing Allocation Index (HAI), the goal was not simply to suggest how many units each part of Los Angeles should produce. It was an attempt to reframe how housing obligations could be evaluated—not by where housing already existed, but by where it should exist, based on factors including longstanding patterns of exclusion, affordability pressure, transit access, environmentally sensitive areas, and socioeconomic opportunity.
The method was intentionally forward-looking. By weighting several factors, the Index offered an alternative to legacy-based planning, and a challenge to the notion that future housing production should mirror past development trends. Now, five years later, the conditions that prompted the Index have only intensified.
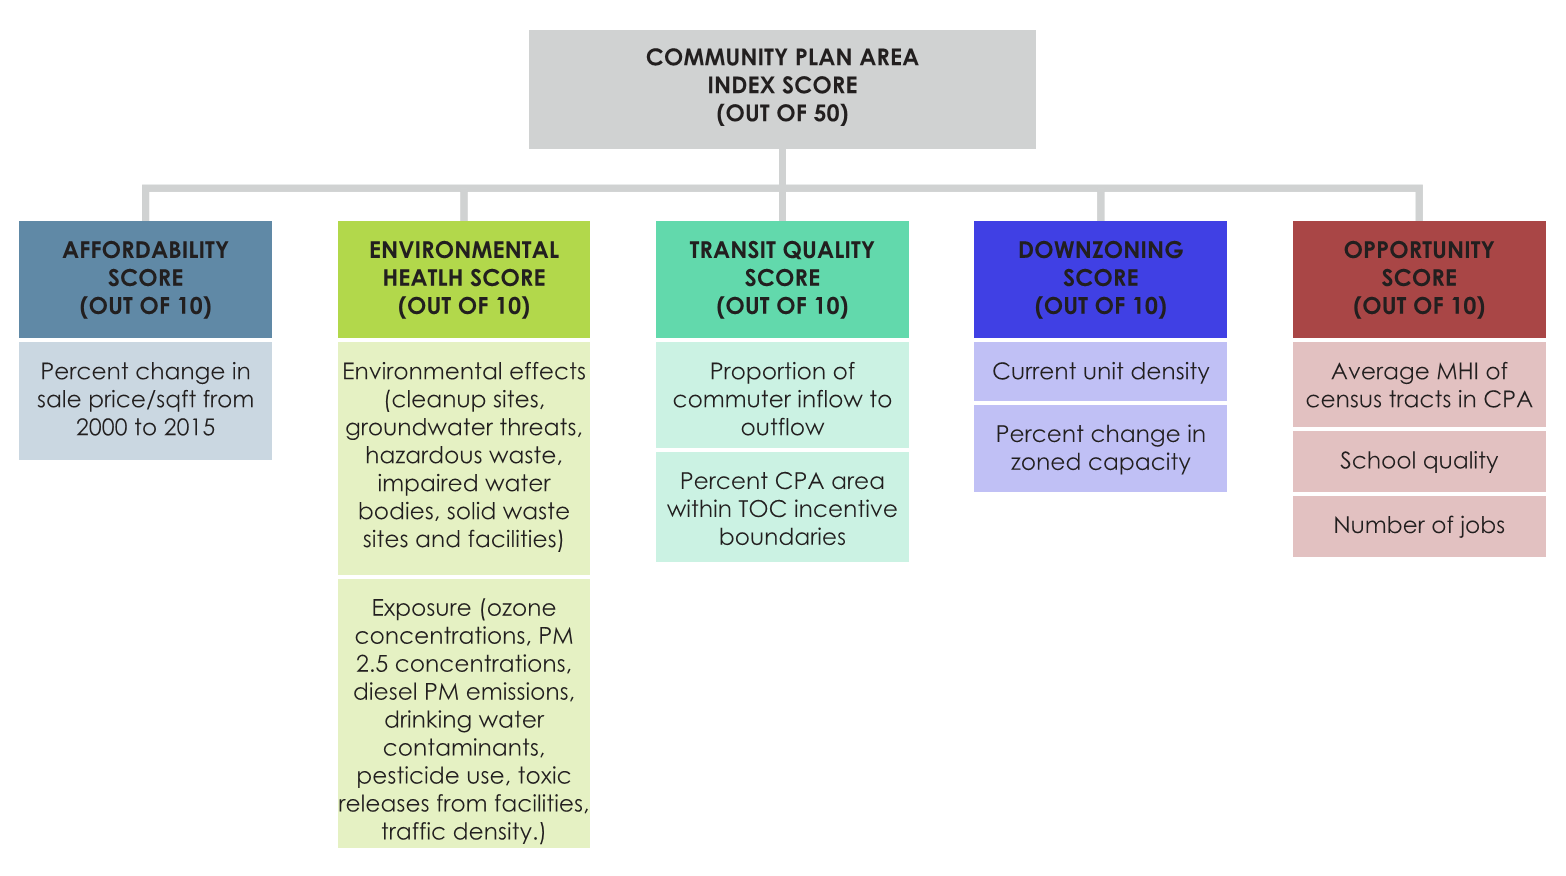
Importantly, the Housing Allocation Index does not attempt to project demand or feasibility. It is a normative tool, not a predictive one. It answers the question:
If we were to distribute the City of Los Angeles’ RHNA obligation based on affordability pressures, environmental health and safety, access to transit, historical patterns of downzoning, and equitable access to schools and economic opportunity—what would that look like?
That question has grown more complex in 2025, particularly in light of the wildfires that devastated parts of Los Angeles earlier this year. The Brentwood–Pacific Palisades Community Plan Area suffered extensive structural loss during the Palisades Fire, which swept through hillside neighborhoods along the city’s western edge. In the northern San Fernando Valley, areas within and adjacent to Sylmar faced evacuations as smaller fires encroached on the wildland–urban interface. These events have only intensified the pressures on an already fragile housing system. Just as critically, they have laid bare the spatial contradictions of Los Angeles’s growth pattern: continued expansion into low-density hillsides and peripheral zones has placed new housing at increasing risk—an approach that is neither resilient nor equitable.
The HAI framework can serve as a corrective. While it does not currently account for wildfire risk directly, its emphasis on transit access, urban density, and infrastructure readiness naturally steers housing away from the wildland–urban interface. In that way, the Index provides an empirical basis for concentrating housing production in safer, better-connected portions of CPAs—particularly those that straddle both vulnerable and resilient areas. A CPA like Sherman Oaks–Studio City–Toluca Lake, for example, contains both hillside fire zones as well as flatter, infrastructure-served neighborhoods along Ventura Blvd and Moorpark St. In such cases, the question is not whether a CPA can accommodate housing, but where within it housing should be directed.
The idea of concentrating development within "fire-safe zones" of existing CPAs is not only feasible, it is aligned with the broader policy direction of the City and State. Recent reforms such as SB 9, SB 10, and the TOC incentive program have explicitly encouraged density within areas already served by transit and infrastructure. The Housing Allocation Index reinforces this approach by identifying which CPAs have historically avoided their share of the housing burden—often through downzoning or community opposition—and which are best equipped to accommodate new growth.
In addition to environmental risk and cost pressures, the Index’s Opportunity Score remains critical. As of 2025, economic disparities between CPAs have widened, not narrowed. Median household income, school performance, and job access remain concentrated in a small subset of neighborhoods—many of which continue to produce housing at a fraction of the pace necessary to meet citywide targets. These neighborhoods score highly on the HAI because they offer the infrastructure, services, and economic stability that make housing growth viable and socially beneficial. Yet in practice, zoning restrictions and political resistance in these areas often inhibit progress.
One of the lessons of the past five years is that production alone is not enough. It matters where we build, and under what conditions. If new housing continues to cluster in already overburdened areas—those with limited transit, under-resourced schools, and high levels of pollution—we risk reinforcing existing inequalities. The HAI offers a method for preventing that outcome. It is not a housing plan in itself, but a tool for guiding planning—especially in the context of ongoing Community Plan updates.
As the City of Los Angeles continues to navigate its long-term housing obligations, the Housing Allocation Index remains a relevant and adaptable framework. It underscores the importance of not just how much we build, but where and why. The conditions of 2025 demand a planning approach that is both data-informed and values-driven—capable of responding to rising costs, environmental shocks, and institutional inertia.
The Center for Pacific Urbanism encourages elected officials, planners, and community advocates to return to the Index as a reference point—not for static answers, but for principled guidance. In a city as complex and contested as Los Angeles, progress depends not just on technical solutions, but on a shared understanding of responsibility. The Housing Allocation Index remains a map to that shared future.